
Image
|
Figure Caption
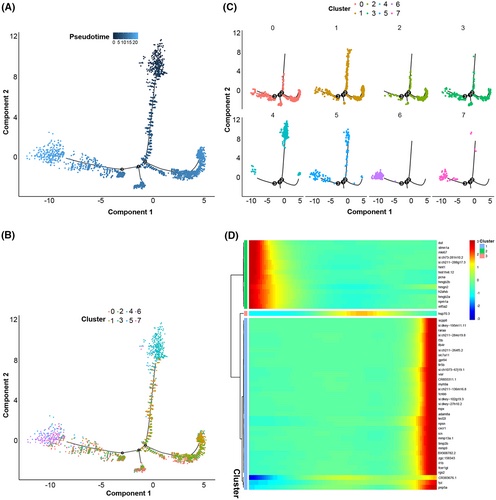
Fig. 4 Pseudotemporal analysis of the development of zebrafish spleen B cells with Monocle. (A, B) Pseudotime single-cell trajectory of B cells reconstructed by Monocle2. The pseudotime is shown colored in a gradient from dark to light blue, and its beginning is indicated. (C) Distribution of the eight B-cell subsets in the trajectory. (D) Pseudotemporal heatmap showing the gene expression dynamics of significant marker genes. Genes (rows) were clustered into three modules, and cells (columns) were ordered in accordance with pseudotime.
Acknowledgments
This image is the copyrighted work of the attributed author or publisher, and
ZFIN has permission only to display this image to its users.
Additional permissions should be obtained from the applicable author or publisher of the image.
Full text @ FASEB J.