IMAGE

Figure 1.

ID
ZDB-IMAGE-231013-11
Source
Figures for Simon et al., 2023
Image
Figure Caption

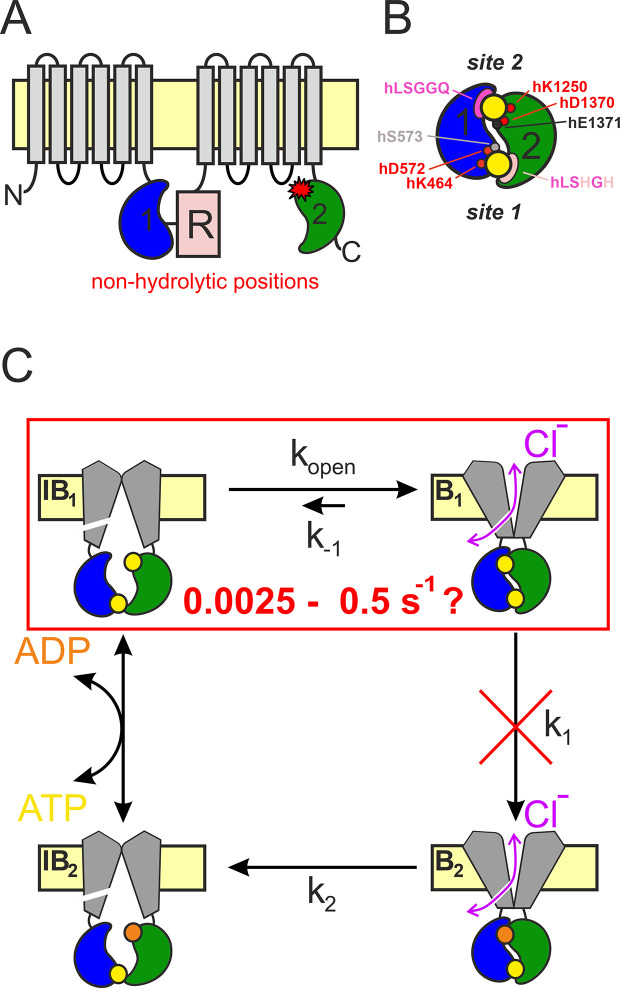
Figure 1. CFTR topology and gating cycle.

(A) Cartoon topology of CFTR. TMD1–2, gray; NBD1, blue; NBD2, green; R-domain, pale red. Red asterisk denotes catalytic site mutations. (B) Cartoon of head-to-tail NBD dimer. Color coding as in (A). ATP, large yellow circles. Site 2 (top): conserved Walker A/B residues, small red circles; catalytic base, small black circle; signature sequence, magenta crescent. Site 1 (bottom): color coding as for site 2, pale residues represent non-conserved substitutions. Residue numbering corresponds to the human CFTR sequence. (C) Schematic gating cycle of phosphorylated CFTR. Flickery closures from states B1 and B2 are not depicted. Disruption of ATP hydrolysis in catalytic site mutants (red cross) reduces gating to reversible IB1 ↔ B1 transitions (red box). Note, that in reality sites 1 and 2 are equally near the membrane, in the cartoons site 2 is depicted as the top and site 1 as the bottom site merely for representation purposes.

Acknowledgments
This image is the copyrighted work of the attributed author or publisher, and ZFIN has permission only to display this image to its users. Additional permissions should be obtained from the applicable author or publisher of the image. Full text @ Elife