
|
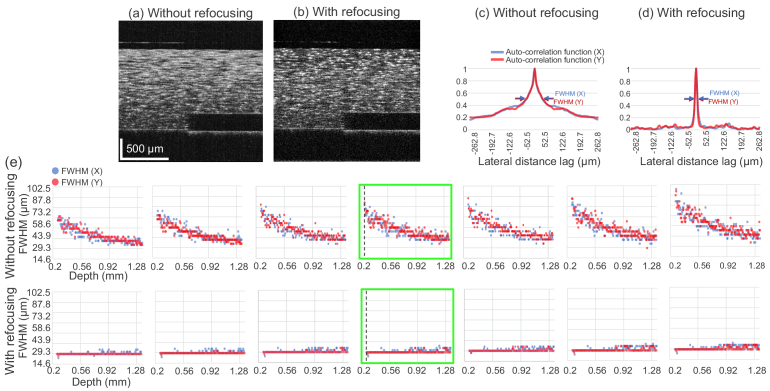
Fig. 5.
(a) and (b) are B-scans at the same location of a phantom volume without and with refocusing, respectively. (c) and (d) show representative spatial auto-correlation functions of the linear-scaled images at a depth [dashed vertical lines in (e)] along both directions without and with applying refocusing, respectively, from which the FWHMs are measured. (e) shows the FWHMs along the depth, which are considered to be proportional to the speckle size. The first and second rows present the results without and with computational refocusing, respectively. Each column presents the results for a volume measured with different focal positions. The blue and red plots show the FWHMs for the fast-scanning (X) and slow-scanning (Y) directions. The B-scans (a) and (b) were taken from the volumes corresponding to the plots highlighted by green boxes. The used volumes are identical to those used for the MFA images in