
Figure 1
- ID
- ZDB-IMAGE-231002-429
- Publication
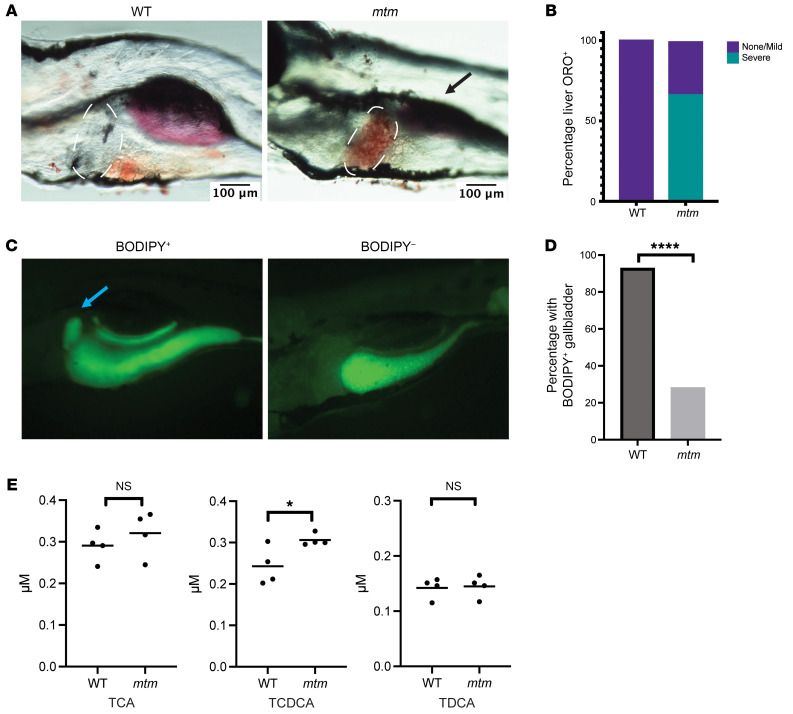
- Karolczak et al., 2023 - Loss of Mtm1 causes cholestatic liver disease in a model of X-linked myotubular myopathy
- All Figures
- Figures for Karolczak et al., 2023
|
Figure 1
(