IMAGE

Figure 2

ID
ZDB-IMAGE-231002-363
Source
Figures for Sarkar et al., 2023
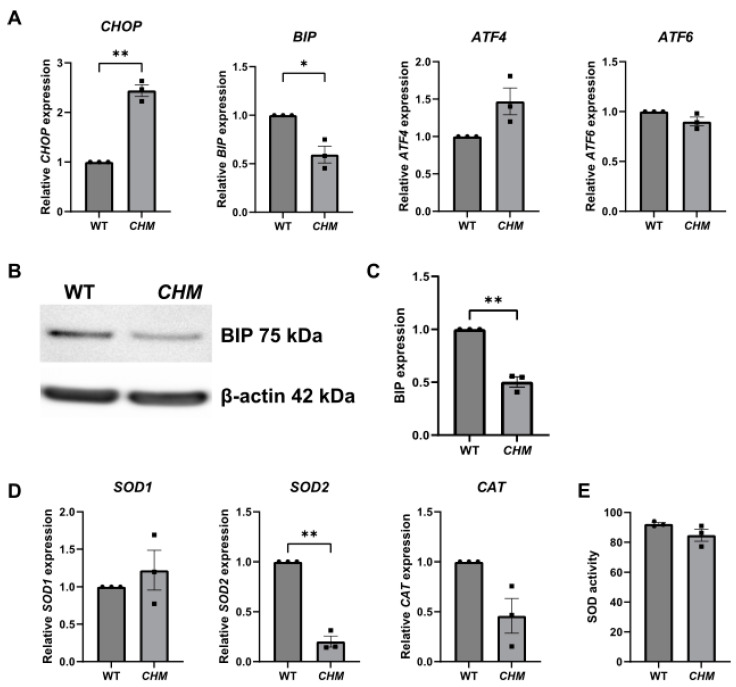
Image
Figure Caption

Figure 2

Increased ER and oxidative stress in CHMY42X patient fibroblasts. (A) The expression of ER stress markers was analysed in WT and CHM fibroblasts using RT-qPCR. Data expressed as mean ± SEM from n = 3. (B) Representative western blot showing reduced BIP protein expression in CHM fibroblasts. (C) Quantification of BIP protein from n = 3 blots. (D) The expression of oxidative stress markers was analysed using RT-qPCR. (E) No significant difference in the SOD enzyme activity between WT and CHM fibroblasts. Data expressed as mean ± SEM from n = 3 (denoted by black dots for wt and black squares for chm fish). * p ≤ 0.05, ** p ≤ 0.01.

Acknowledgments
This image is the copyrighted work of the attributed author or publisher, and ZFIN has permission only to display this image to its users. Additional permissions should be obtained from the applicable author or publisher of the image. Full text @ Antioxidants (Basel)