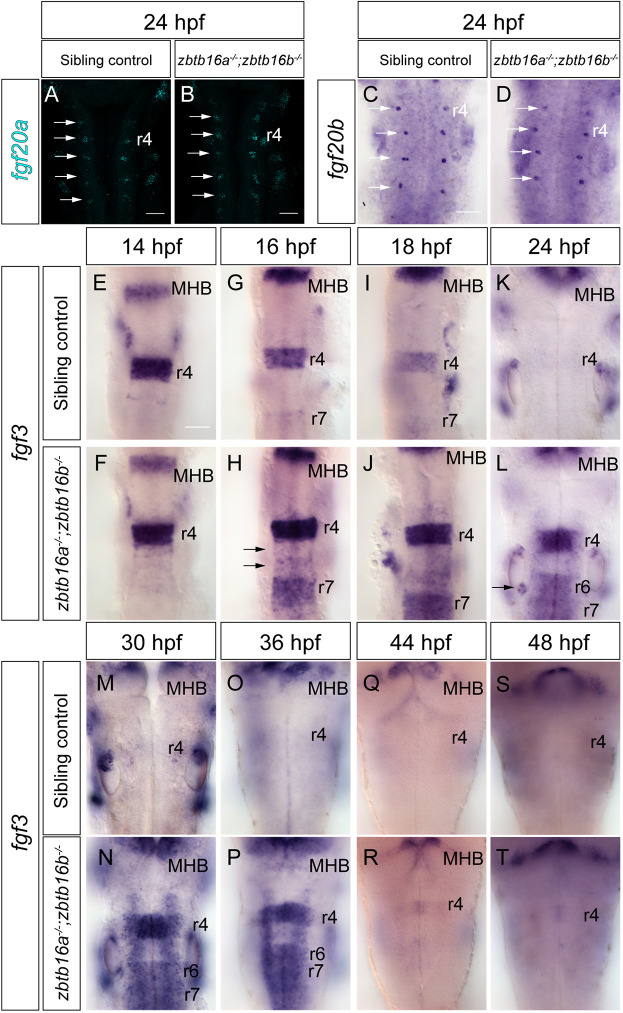
Expression of Fgf ligands in Zbtb16 mutants. (A,B) HCR for fgf20a in 24 hpf sibling control (n=26) and zbtb16a−/−;zbtb16b−/− (n=12) embryos. 3D reconstructions of the z-stack, dorsal view. (C,D) Colorimetric ISH for fgf20b in 24 hpf sibling control (n=15) and zbtb16a−/−;zbtb16b−/− (n=4) embryos. Arrows in A-D indicate fgf20-expressing neuronal clusters in rhombomere centres. (E-T) ISH time-course of fgf3 expression in the sibling control (14 hpf: n=19; 16 hpf: n=26; 18 hpf: n=53; 24 hpf: n=47; 30 hpf: n=10; 36 hpf: n=35; 44hpf: n=20; 48 hpf: n=43) and zbtb16a−/−;zbtb16b−/− (14 hpf: n=6; 16 hpf: n=10; 18 hpf: n=20; 24 hpf: n=12; 30 hpf: n=5; 36 hpf: n=13; 44 hpf: n=10; 48 hpf: n=12) hindbrain. Arrows in H indicate ectopic expression in r5/r6, arrow in L indicates ectopic expression in the posterior otic vesicle. MHB, midbrain-hindbrain boundary; r, rhombomere. Scale bars: 50 µm.
Acknowledgments
This image is the copyrighted work of the attributed author or publisher, and
ZFIN has permission only to display this image to its users.
Additional permissions should be obtained from the applicable author or publisher of the image.
Full text @ Development
Your Input Welcome
Thank you for submitting comments. Your input has been emailed to ZFIN curators who may contact you if
additional information is required.
Oops. Something went wrong. Please try again later.