IMAGE

Figure 2.

ID
ZDB-IMAGE-230916-76
Source
Figures for Faught et al., 2023
Image
Figure Caption

Figure 2.

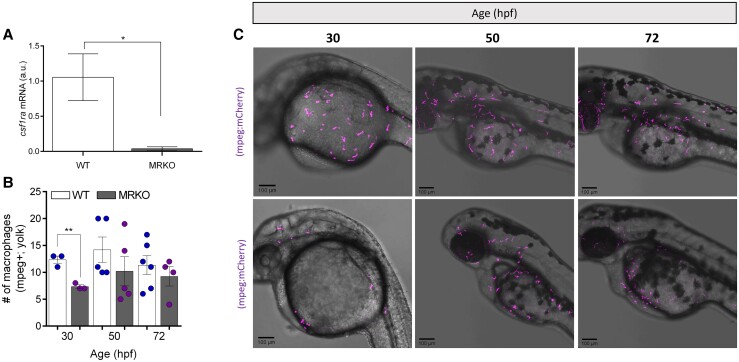
A loss of MR impacts macrophage production and distribution during development. (A) Transcript abundance of csf1ra in FACS-sorted macrophages from WT and MRKO larvae at 48 hours postfertilization (hpf), determined by qPCR (n = 3). (B) Number of mpeg+ macrophages in the yolk at 30, 50, and 72 hpf in WT and MRKO embryos/larvae at different stages of development (n = 3-5). (C) Representative images of mpeg+ macrophage (magenta) populations within the yolk of Tg(mpeg:mCherry);nr3c2+/+ (WT) or Tg(mpeg:mCherry);nr3c2inr11/inr11 (MRKO) larvae at 30, 54, and 72 hpf. Scale bar: 100 µm. Bars show mean ± SEM of data pooled from 3 different experiments (B; each data point representing a single embryo/larva). Data were analyzed using a 2-way ANOVA (Holm-Sidak post hoc test). Statistical significance is indicated by *P ≤ .05, **P ≤ .01.

Acknowledgments
This image is the copyrighted work of the attributed author or publisher, and ZFIN has permission only to display this image to its users. Additional permissions should be obtained from the applicable author or publisher of the image. Full text @ Endocrinology