IMAGE

FIGURE 3

ID
ZDB-IMAGE-230916-245
Source
Figures for Nishida et al., 2023
Image
Figure Caption

FIGURE 3

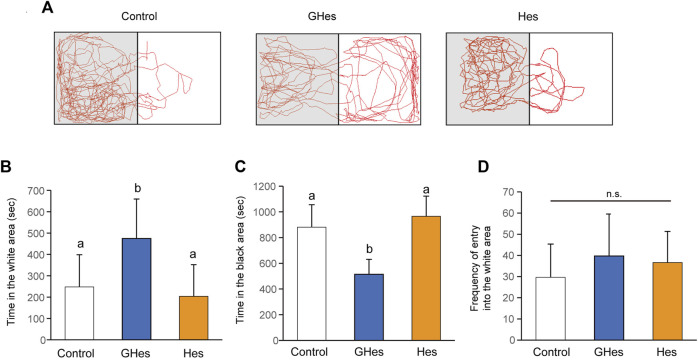
Effect of GHes and Hes on zebrafish behavior in the black-white preference test. Zebrafish were fed control, GHes, or Hes diet for 21 days and subjected to the black-white preference test. (A) Tracking zebrafish behavior. The gray and white colors in this picture indicate the black and white areas in the test tank, respectively. (B) Total swimming time in the white area. (C) Total swimming time in the black area. (D) Frequency of invasion of the white area. Results are shown as means ± standard deviation. n = 10. n.s., not significant. Columns with the same letter are not statistically different, and vice versa.

Acknowledgments
This image is the copyrighted work of the attributed author or publisher, and ZFIN has permission only to display this image to its users. Additional permissions should be obtained from the applicable author or publisher of the image. Full text @ Front Pharmacol