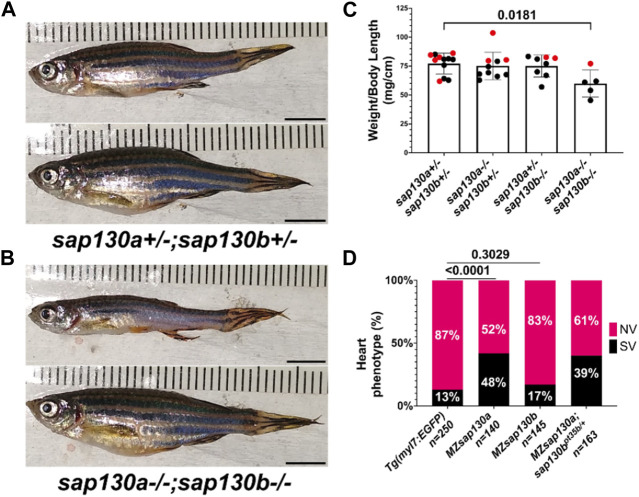
MZsap130a;sap130bpt35b/pt35b mutants are not healthy (A) sap130a;sap130b double heterozygous adults, male (top) and female (bottom). (B) sap130a;sap130b double homozygous adults, male (top) and female (bottom). (C) Graph quantifying weight to length ratio for adults from a sap130a;sap130b double heterozygous in-cross, pvals are for one-way ANOVA, error bars are standard error mean (SEM). Red points represent females and males in black. (D) Graph quantifying the heart phenotype proportions for Tg(myl7:EGFP), MZsap130a;Tg(myl7:EGFP), MZsap130b;Tg(myl7:EGFP), and MZsap130a;sap130bpt35b/+;Tg(myl7:EGFP), pvals are for fisher’s exact test. Scale bar 5 mm.
This image is the copyrighted work of the attributed author or publisher, and
ZFIN has permission only to display this image to its users.
Additional permissions should be obtained from the applicable author or publisher of the image.
Full text @ Front Cell Dev Biol
Your Input Welcome
Thank you for submitting comments. Your input has been emailed to ZFIN curators who may contact you if
additional information is required.
Oops. Something went wrong. Please try again later.