
Fig. 4
- ID
- ZDB-IMAGE-230915-4
- Publication
- Patterson et al., 2023 - Abrogation of MAP4K4 protein function causes congenital anomalies in humans and zebrafish
- All Figures
- Figures for Patterson et al., 2023
|
Fig. 4
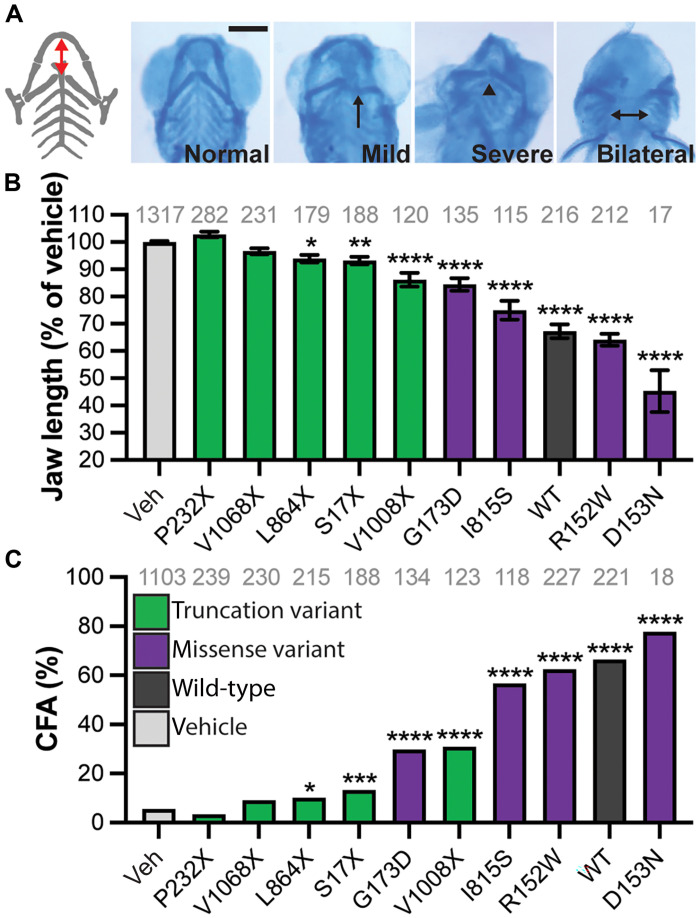
(A) Representative ventral view of Alcian blue staining of jaw cartilage. Schematic of the cartilages shown in gray with the distance between the Meckel’s and ceratohyal cartilages shown by a red arrow. Malformations included misshapen cartilage (arrow), increased angle between ceratohyal cartilages (arrowhead), and bilateral positioning of cartilage (double-headed arrow). (B) Jaw length was measured and normalized to the average of the vehicle-injected siblings (Veh) and is reduced by expression of MAP4K4WT and missense variants. (C) The incidence of malformations was quantified as a percentage of total larvae showing a defect. Scale bar, 200 μm (A). Graphs (B to C): pale gray, vehicle; dark gray, MAP4K4WT; purple, missense variants; green, truncation variants. *P < 0.05; **P < 0.01; ***P < 0.001; ****P < 0.0001 by pairwise Student’s t test (B) or chi-square test (C) compared to vehicle. ANOVA gives P < 0.0001 for (B). n numbers are inset to graphs in gray text. Error bars represent the SEM.