
Image
|
Figure Caption
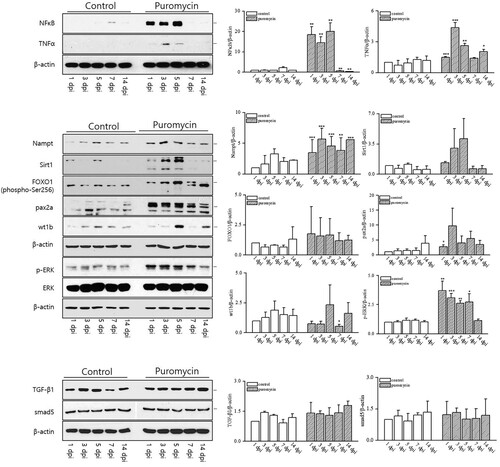
Fig. 5 The renal molecular pathways induced by puromycin administration. NFκB production increased significantly from 1 dpi to 5 dpi and then decreased until 14 dpi. TNFα increased at 1, 3, 5, and 14 dpi. Nampt expression also increased significantly from 1 to 14 dpi. p-ERK increased significantly during nephron injury and regeneration. *p < 0.5 **p < 0.01 ***p < 0.001 vs. controls (SPSS, Student’s t-test)
Acknowledgments
This image is the copyrighted work of the attributed author or publisher, and
ZFIN has permission only to display this image to its users.
Additional permissions should be obtained from the applicable author or publisher of the image.
Full text @ Animal Cells Syst (Seoul)