
Image
|
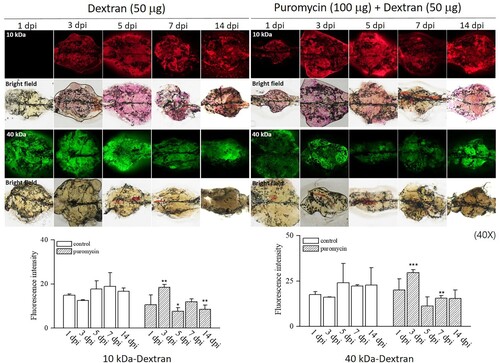
Figure Caption
Fig. 2 Dextran filtration assays. The puromycin-treated group showed higher fluorescence intensity than the controls at 3 dpi and lower fluorescence intensity than the controls at 5, 7, and 14 dpi. Both 10 and 40 kDa rhodamine dextran washed out of the kidneys of puromycin-treated zebrafish more rapidly than from the controls. *p < 0.5 **p < 0.01 ***p < 0.001 vs. controls
Acknowledgments
This image is the copyrighted work of the attributed author or publisher, and
ZFIN has permission only to display this image to its users.
Additional permissions should be obtained from the applicable author or publisher of the image.
Full text @ Animal Cells Syst (Seoul)