
|
Fig. 1
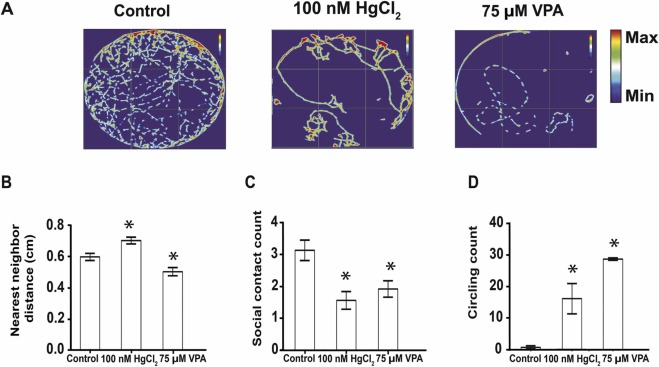
Fig. 1. Changes in social response in 10 dpf zebrafish after embryonic exposure to HgCl2 or VPA. (A) Heatmap of swimming tracking for a group of 10 larvae for 6 min recording in a 9 cm diameter petri dish. Red color indicates highly active exploration regions of group behavior. (B) Nearest neighbor distance was significantly increased in HgCl2–exposed zebrafish, while it was reduced in VPA exposed zebrafish compared to control groups. (C) Number of social contacts between individual animals in HgCl2 −or VPA−exposed zebrafish were significantly reduced. (D) Abnormal circling behavior was observed in both HgCl2 − and VPA−exposed larvae (mean ± SEM: *p < 0.005, n = 30 for each group, 10 animals in a group, repeated 3 times).