
Image
|
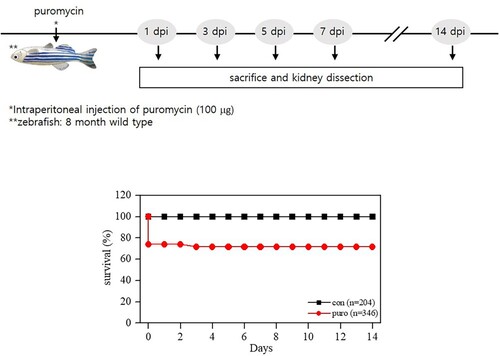
Figure Caption
Fig. 1 Survival after puromycin administration. The flowchart shows the schematic timeline of the experimental procedures. Approximately 75% of the injected animals survived on day 0 and showed no mortality until sacrifice. dpi, days post-injection; con, control; puro, puromycin
Acknowledgments
This image is the copyrighted work of the attributed author or publisher, and
ZFIN has permission only to display this image to its users.
Additional permissions should be obtained from the applicable author or publisher of the image.
Full text @ Animal Cells Syst (Seoul)