
|
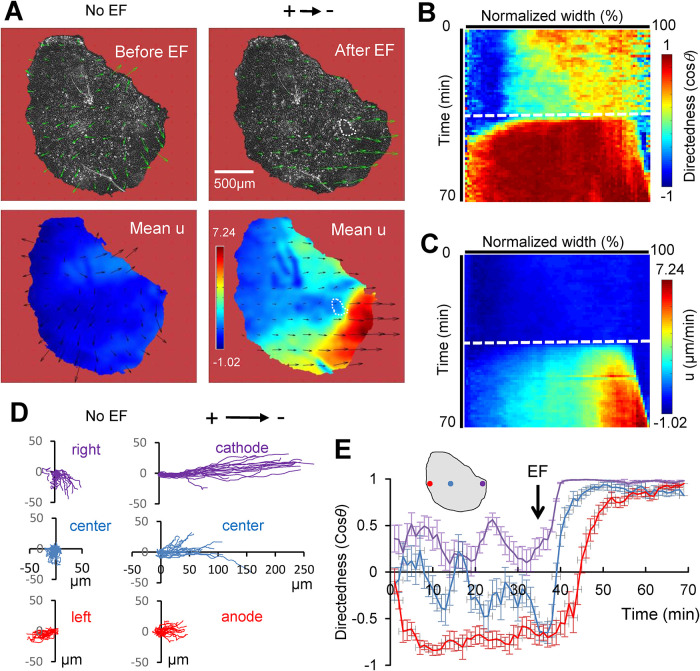
Fig. 2
EF induces a distinct front-to-rear polarization pattern, resulting in regional migratory behavior. (A) PIV analysis of a representative keratocyte group (of approximately 7600 keratocytes) before (left panel) and after (right panel) EF application. Top row shows velocity vectors overlaid on phase contrast image; in the bottom row, color-coded, time-averaged components of velocity parallel to EF are shown (in µm/min, for EF of 2 V/cm). Scale bar, 500 µm. Note the increased alignment and magnitude of the velocity vectors, as well as regional front-to-rear differences induced by EF. White dashed enclosure highlights a hole in the group that was induced by EF. (B) Color-coded kymograph of directionality (cosθ). Vertical dimension is time in minutes, and horizontal dimension is projected mean directionality (cosθ) spanning the whole width of the keratocyte group; the EF oriented to the right. Dashed line indicates when EF (2 V/cm) is on. (C) Color-coded kymograph of the u-component (parallel to the EF) velocity in µm/min. Vertical dimension is time in minutes, and horizontal dimension is the projected time-averaged u-velocity spanning the whole width of the group. (D) Manually tracked cell trajectories in three regions (left, center, right) (n = 20 for each color-coded region) of the group before and after EF (2 V/cm in the indicated direction) application. Distances are in µm, and duration is 35 min. (E) Dynamics of mean directedness (cosθ) of the tracked regional cells. Directedness is calculated at 5 min intervals from a representative group in at least three repeated experiments. Error bars are SE for n = 20 regional cells. Color codes are the same as in D (positions are approximate). Arrow indicates when EF was switched on.