
Image
|
Figure Caption
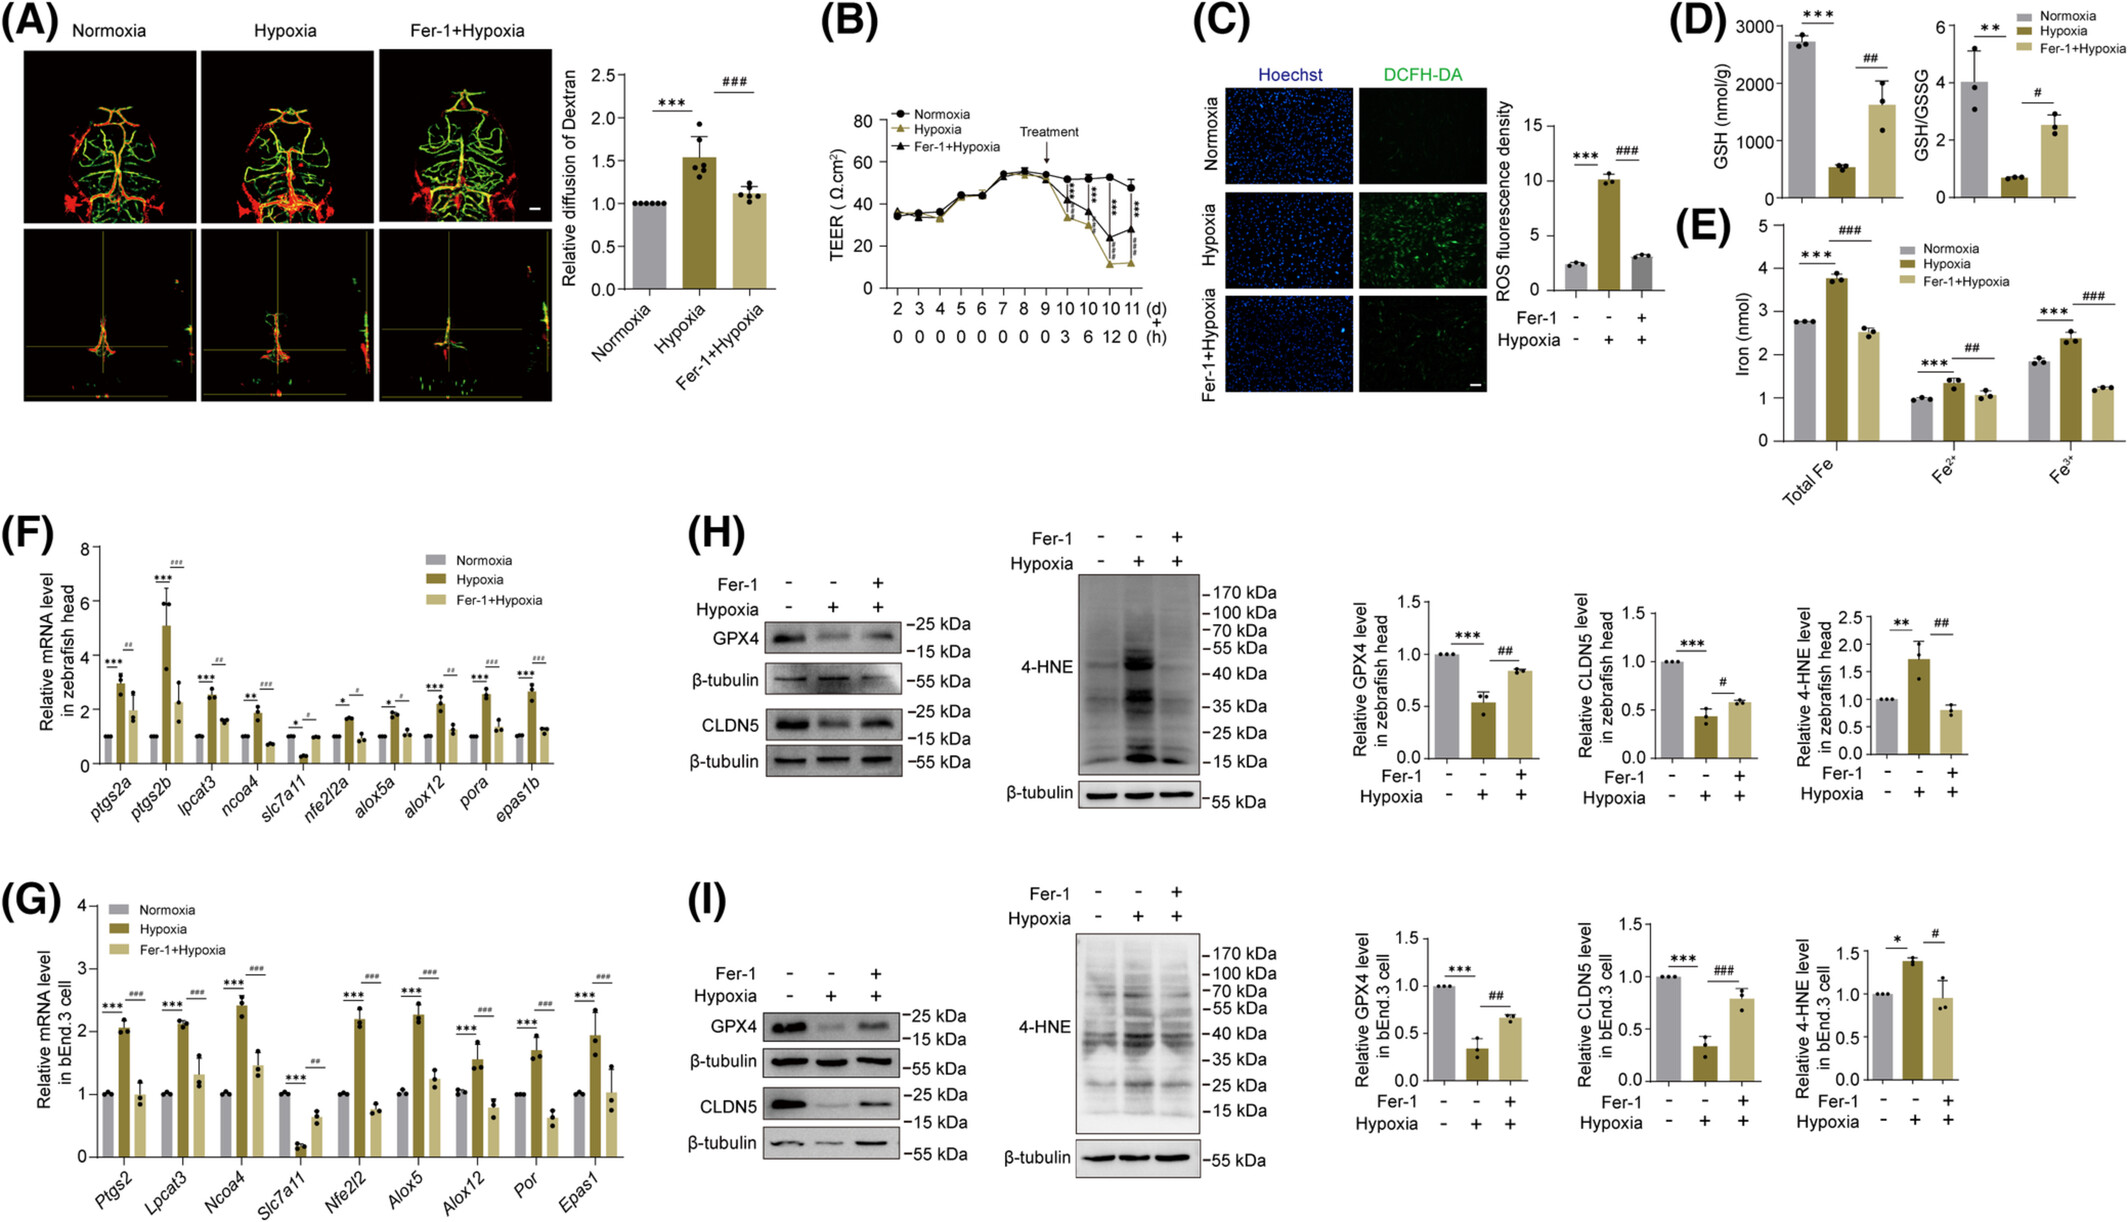
Fig. 4
Ferroptosis inhibitor Fer-1 partially alleviated hypoxia-induced BBB disruption. (A) BBB disruption was measured by quantifying Rhodamine-Dextran dye leakage. N = 6 fish per group. Mean ± SD, one-way ANOVA, normoxia vs. hypoxia, ***p < .0001; hypoxia vs. Fer-1 + hypoxia, ###p = .0005. Scale bar: 50 μm. (B) BBB permeability detection. “Treatment” indicates the time point of hypoxia induction after the bEnd.3 cell monolayer reaches a stable TEER value. Mean ± SD, two-way ANOVA, normoxia vs. hypoxia (3 h), ***p < .0001; normoxia vs. hypoxia (6 h), ***p < .0001; normoxia vs. hypoxia (12 h), ***p < .0001; normoxia vs. hypoxia (24 h), ***p < .0001; hypoxia vs. Fer-1 + hypoxia (3 h), ###p < .0001; hypoxia vs. Fer-1 + hypoxia (6 h), ###p < .0001; hypoxia vs. Fer-1 + hypoxia (12 h), ###p < .0001; hypoxia vs. Fer-1 + hypoxia (24 h), ###p < .0001. (C) Representative images of bEnd.3 cells stained with ROS assay kit and Hoechst. Mean ± SD, one-way ANOVA, normoxia vs. hypoxia, ***p < .0001; hypoxia vs. Fer-1 + hypoxia, ###p < .0001. scale bar: 100 μm. (D) Measurement of GSH and GSH/GSSG ratio in zebrafish head. Mean ± SD, one-way ANOVA, normoxia vs. hypoxia (GSH), ***p < .0001; hypoxia vs. Fer-1 + hypoxia (GSH), ##p = .0041; normoxia vs. hypoxia (GSH/GSSG), **p = .0019; hypoxia vs. Fer-1 + hypoxia (GSH/GSSG), #p = .0315. N = 200 fish per group. (E) Determination of iron content in bEnd.3 cells. Mean ± SD, two-way ANOVA, normoxia vs. hypoxia (Total Fe), ***p < .0001; normoxia vs. hypoxia (Fe2+), ***p = .0002; normoxia vs. hypoxia (Fe3+), ***p < .0001; hypoxia vs. Fer-1 + hypoxia (Total Fe), ###p < .0001; hypoxia vs. Fer-1 + hypoxia (Fe2+), ##p = .0032; hypoxia vs. Fer-1 + hypoxia (Fe3+), ###p < .0001. (F) The mRNA expression levels of ferroptosis-related genes in the head of zebrafish. Mean ± SD, one-way ANOVA, * or #p < .05, ** or ##p < .01, *** or ###p < .001. N = 80 fish per group. (G) The mRNA expression levels of ferroptosis-related genes in bEnd.3 cells. Mean ± SD, one-way ANOVA, ##p < .01, *** or ###p < .001. N = 100 fish per group. (H) The protein levels of GPX4, CLDN5 and 4-HNE in zebrafish head were detected by immunoblotting assay. Mean ± SD, one-way ANOVA, normoxia vs. hypoxia (GPX4), ***p = .0002; hypoxia vs. Fer-1 + hypoxia (GPX4), ##p = .0017; normoxia vs. hypoxia (CLDN5), ***p < .0001; hypoxia vs. Fer-1 + hypoxia (CLDN5), #p = .0208; normoxia vs. hypoxia (4-HNE), **p = .0091; hypoxia vs. Fer-1 + hypoxia (4-HNE), ##p = .0027. N = 100 fish per group. (I) Protein expression levels of GPX4, CLDN5 and 4-HNE in bEnd.3 cells were analyzed by immunoblotting analysis. Mean ± SD, one-way ANOVA, normoxia vs. hypoxia (GPX4), ***p < .0001; hypoxia vs. Fer-1 + hypoxia (GPX4), ##p = .0018; normoxia vs. hypoxia (CLDN5), ***p = .0001; hypoxia vs. Fer-1 + hypoxia (CLDN5), ###p = .0010; normoxia vs. hypoxia (4-HNE), *p = .0182; hypoxia vs. Fer-1 + hypoxia (4-HNE), #p = .0108. N = 100 fish per group.
Acknowledgments
This image is the copyrighted work of the attributed author or publisher, and
ZFIN has permission only to display this image to its users.
Additional permissions should be obtained from the applicable author or publisher of the image.
Full text @ FASEB J.