
Image
|
Figure Caption
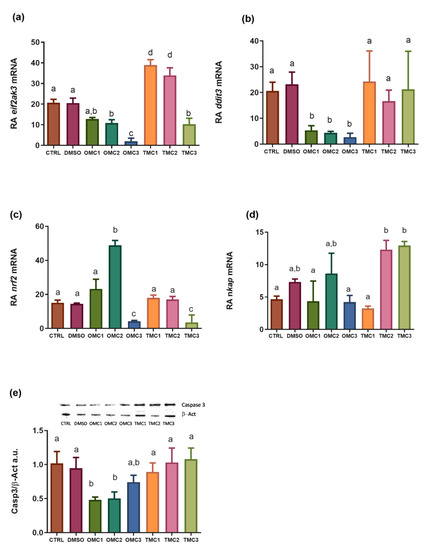
Fig. 5 Expression profiles of ER stress biomarkers. (a) eif2ak3, (b) ddit3, (c) nrf2, (d) nkap mRNA, and (e) Casp3 protein levels in larvae exposed to the different experimental treatments. mRNA levels were normalized against rplp0 and rplp13 and used as reference genes. Cleaved caspase 3 (Casp3) (17 KDa) levels were normalized against b-actin (b-Act) (42 KDa). Insert (e) shows representative Casp3 and β-Act blots. Data are shown as the mean ± SD. Different letters indicate statistically significant differences among the experimental groups (p < 0.05).
Acknowledgments
This image is the copyrighted work of the attributed author or publisher, and
ZFIN has permission only to display this image to its users.
Additional permissions should be obtained from the applicable author or publisher of the image.
Full text @ Int. J. Mol. Sci.