
Fig. 5
- ID
- ZDB-IMAGE-230904-5
- Publication
- Bi et al., 2023 - Polysarcosine-based lipid formulations for intracranial delivery of mRNA
- All Figures
- Figures for Bi et al., 2023
|
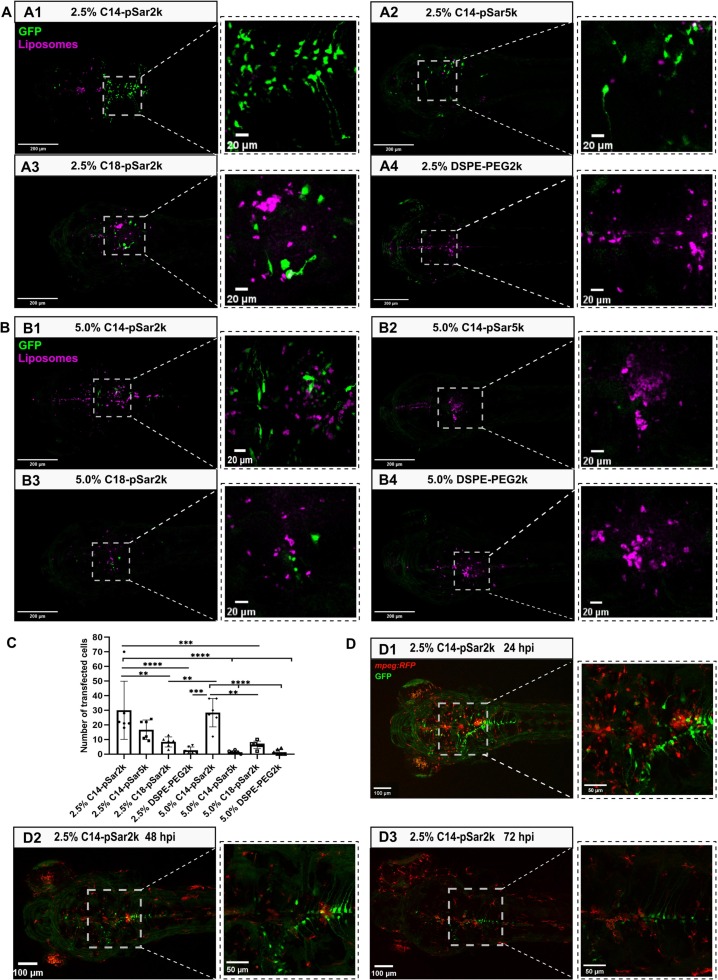
Fig. 5 GFP expression within 2.5 dpf zebrafish embryos at 24 hpi in the dorsal view. 1.5 nL lipoplexes (DOTAP/DOPE/DSPE-Rhodamine B/pSar-lipid or DSPE-PEG2k, 30 mM, N/P 10) containing GFP mRNA (100 ng/μL) were injected into the zebrafish brain. (A-C) GFP (green) expression in wildtype ABTL zebrafish embryos that were injected with (A1-A4) 2.5% C14-pSar2k, C14-pSar5k, C18-pSar2k and DSPE-PEG2k lipoplexes (magenta) and (B1-B4) 5.0% C14-pSar2k, C14-pSar5k, C18-pSar2k and DSPE-PEG2k lipoplexes in dorsal view (scale bar: 200 μm). (C) Quantification of GFP-expressing cells in the brain of zebrafish embryos after intracranial injection (n = 6). (D) GFP (green) expression within 2.5 dpf Tg(mpeg1: RFP) zebrafish embryos (macrophages in magenta) at (D1) 24 hpi, (D2) 48 hpi and (D3) 72 hpi in the dorsal view of brain (scale bar: 200 μm, 100 μm, 50 μm). (For interpretation of the references to colour in this figure legend, the reader is referred to the web version of this article.)