
Fig. 4
- ID
- ZDB-IMAGE-230904-4
- Publication
- Bi et al., 2023 - Polysarcosine-based lipid formulations for intracranial delivery of mRNA
- All Figures
- Figures for Bi et al., 2023
|
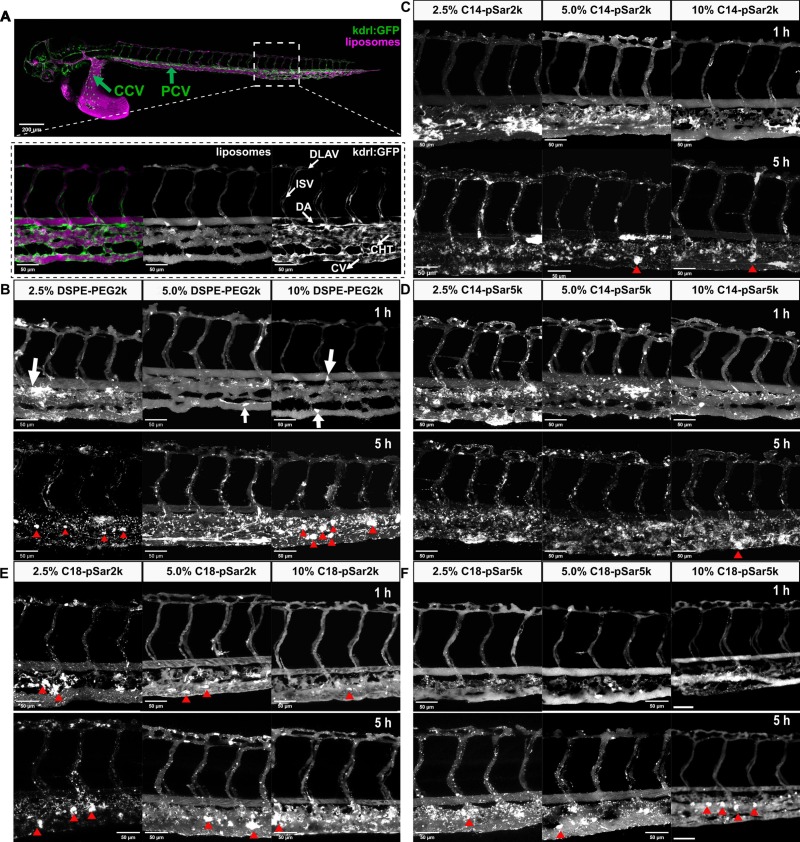
Fig. 4 Biodistribution of liposomes (1 nL, 30 mM) modified with (B) DSPE-PEG2k, (C) C14-pSar2k, (D) C14-pSar5k, (E) C18-pSar2k and (F) C18-pSar5k after intravenous injection into 2.5 dpf zebrafish embryos. (A) Representative images of whole embryo view at 1 h after administration with 10% PEGylated liposomes. Tg (Kdrl:GFP) zebrafish embryos expressed GFP (green) within all endothelial cells (ECs). Common cardinal vein (CCV) and posterior cardinal vein (PCV) are the two main venous vessels, as green arrows indicate. Different blood vessels were indicated by white arrows: dorsal aorta (DA), caudal hematopoietic tissue (CHT), caudal vein (CV), intersegmental vessel (ISV), dorsal longitudinal anastomotic vessel (DLAV). PE-LR labeled liposomes were shown in magenta. Tissue level views (40× lens, magnification of the white square) displayed the merged image of liposomes (magenta) and ECs (green) and separated images in gray. (B---F) Representative biodistribution images of (B) 2.5%, 5.0% and 10% PEGylated liposomes (C) C14-pSar2k-, (D) C14-pSar5k-, (E) C18-pSar2k- and (F) C18-pSar5k-coated liposomes in 2.5 dpf zebrafish embryos at 1 hpi and 5 hpi. White arrows show liposome aggregates at 1 hpi, and red triangles show that the liposomes were internalized into macrophages. Scale bar: 200 μm for whole embryo view and 50 μm for tissue level view. (For interpretation of the references to colour in this figure legend, the reader is referred to the web version of this article.)