
Fig. 3
- ID
- ZDB-IMAGE-230829-13
- Publication
- Weinschutz Mendes et al., 2023 - High-throughput functional analysis of autism genes in zebrafish identifies convergence in dopaminergic and neuroimmune pathways
- All Figures
- Figures for Weinschutz Mendes et al., 2023
|
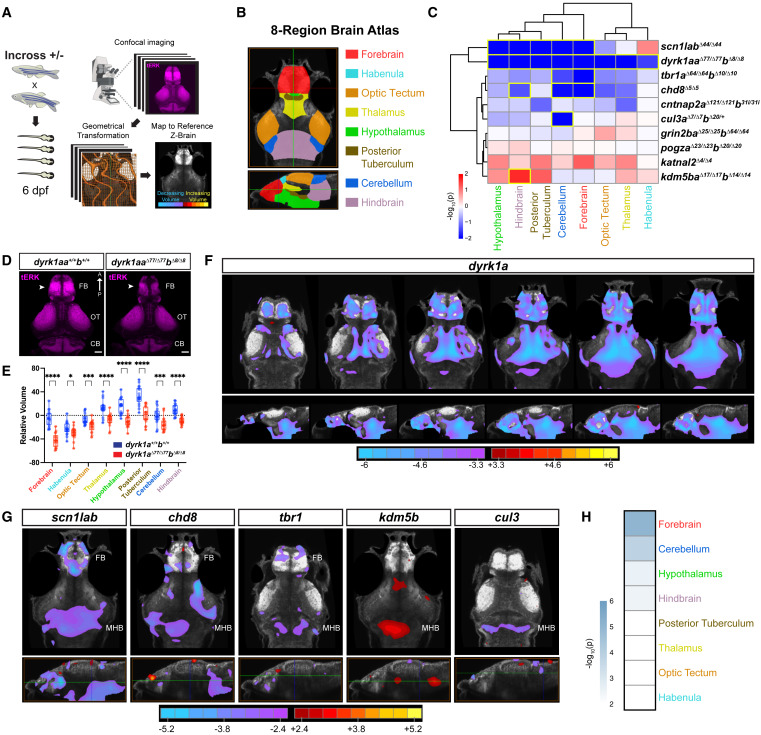
Fig. 3 Zebrafish mutants of ASD genes display brain size phenotypes
(A) Whole-brain volume mapping pipeline (STAR Methods).
(B) Eight-region zebrafish brain atlas derived from Thyme et al. (2019) and Randlett et al. (2015).22,42
(C) Hierarchical clustering of regional brain volume measurements comparing mutant and background-matched wild-type fish. Each rectangle in the clustergram represents the signed -log10-transformed p values from linear mixed models (LMM) (red, increased in mutant; blue, decreased in mutant). Regions with significant volume differences by LMM (p < 0.05) are outlined in yellow. p-values for homozygous and heterozygous mutants are shown in Figure S3A. For raw volume quantifications by region for all fish, see Table S3.
(D) tERK-immunostained brains of dyrk1aaΔ77/Δ77dyrk1abΔ8/Δ8 and wild-type larvae at 6 dpf. Note the decrease in forebrain volume in mutants (arrowheads). Dorsal views. FB, forebrain; OT, optic tectum; CB, cerebellum. Scale bar, 50 μm.
(E) Regional brain volume differences in dyrk1aaΔ77/Δ77dyrk1abΔ8/Δ8 (n = 18) and wild-type (n = 18) relative to the standard zebrafish reference brain 42 (dotted line). ∗∗∗∗p < 0.0001, ∗∗∗p < 0.001, ∗p < 0.05 (one-way ANOVA).
(F) Voxel-wise Z score values representing brain volume differences in dyrk1aaΔ77/Δ77dyrk1abΔ8/Δ8 versus background-matched wild-type larvae. Images shown from left to right represent sequential slices: axial views, top row, dorsal to ventral; sagittal views, bottom row, lateral to medial. Scale bar, Z score (red/yellow, increased in mutant; cyan/purple, decreased in mutant).
(G) Voxel-wise Z score values representing brain volume differences for the following lines: scn1labΔ44/Δ44, chd8Δ5/Δ5, tbr1aΔ64/Δ64tbr1bΔ10/Δ10, kdm5baΔ17/Δ17kdm5bbΔ14/Δ14, and cul3aΔ7/Δ7cul3bΔ20/+. Axial views, top row; sagittal views, bottom row. The horizontal green line in the sagittal view indicates the slice shown in the axial view. FB, forebrain; MHB, midbrain-hindbrain boundary. Scale bar, Z score (red/yellow, increased in mutant; cyan/purple, decreased in mutant). For the number of animals used in imaging experiments, see STAR Methods (average n = 23–26 per genotype in two to four independent clutches).
(H) Genotype-level p values for each brain region combined for all homozygous mutants and cul3aΔ7/Δ7cul3bΔ20/+, excluding dyrk1a, using Fisher’s method. Scale represents the -log10-transformed combined p value. The forebrain (telencephalon) shows the most significant difference in volume (p = 8.32 × 10⁻⁶, Fisher’s combined probability test).