IMAGE

Fig. 8.

ID
ZDB-IMAGE-230823-23
Source
Figures for Mi et al., 2023
Image
Figure Caption

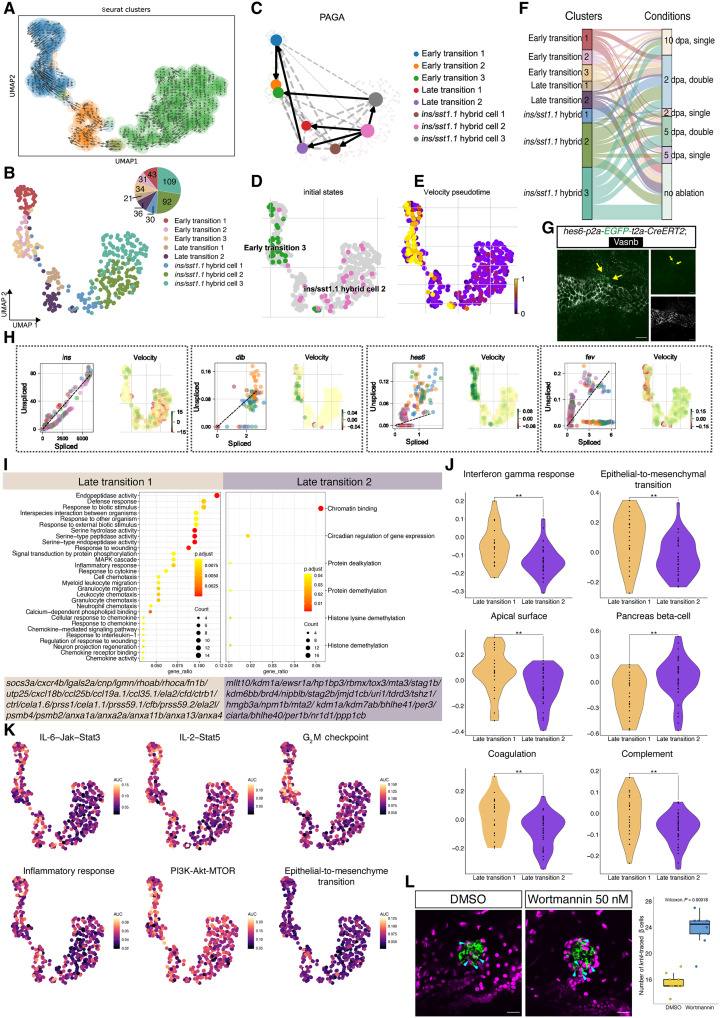
Fig. 8. Velocity-based analyses and pathway validation.

(A) UMAP colored by latent time progression. Cells later in the trajectory (determined by RNA velocity) are yellow. The UMAP is overlaid by arrows indicating the extrapolated future cell states identified through RNA velocity analysis, suggesting that both differentiation and dedifferentiation processes occur simultaneously during insulin-producing cell recovery. (B) UMAP projection of transition-to-ins+/sst1.1+ hybrid cells with eight subclusters (three early transition cell states, two late transition cell states, and three ins+/sst1.1+ hybrid cell states). (C) The PAGA analysis indicates dedifferentiation process. (D and E) The root identification and velocity-based pseudotime results by CellRank. (F) Graphical summary using Sankey plots demonstrating the relationship between cell states (left) and condition (right). (G) Representative single-plane confocal image of hes6+ cells from the immunostaining of the knock-in hes6-p2a-EGFP-t2a-CreERT zebrafish line. The yellow arrows point to two EGFP+ cells adjacent to the duct. (H) Scatterplots showing the level of unspliced versus spliced transcripts of cell state specific genes. (I) GO analysis of up-regulated genes expressed in late transition 1 and late transition 2 cells, with enriched gene shown below. Dot plots showing the differentially enriched GO terms colored by adjusted P value and sized by gene ratio. MAPK, mitogen-activated protein kinase. (J) Violin plots and dot plots highlighting the differential gene set scores between late transition 1 and late transition 2 cells using single-cell gene set variation analysis. (K) UMAP plot showing the statistically significant gene activity scores in each cell. IL-6, interleukin-6; Jak, Janus kinase; Stat3, signal transducers and activators of transcription 3; AUC, area under the curve. (L) Representative single-plane confocal images and quantifications of β cells following treatment with either dimethyl sulfoxide (DMSO) or the PI3K inhibitor wortmannin. Treatment with wortmannin increased the number of newly generated krt4-derived β cells (mCherry+/insulin+; Wilcoxon test) in the basal state (without β cell ablation). Scale bars, 40 μm.

Acknowledgments
This image is the copyrighted work of the attributed author or publisher, and ZFIN has permission only to display this image to its users. Additional permissions should be obtained from the applicable author or publisher of the image. Full text @ Sci Adv