IMAGE

Fig. 4.

ID
ZDB-IMAGE-230823-19
Source
Figures for Mi et al., 2023
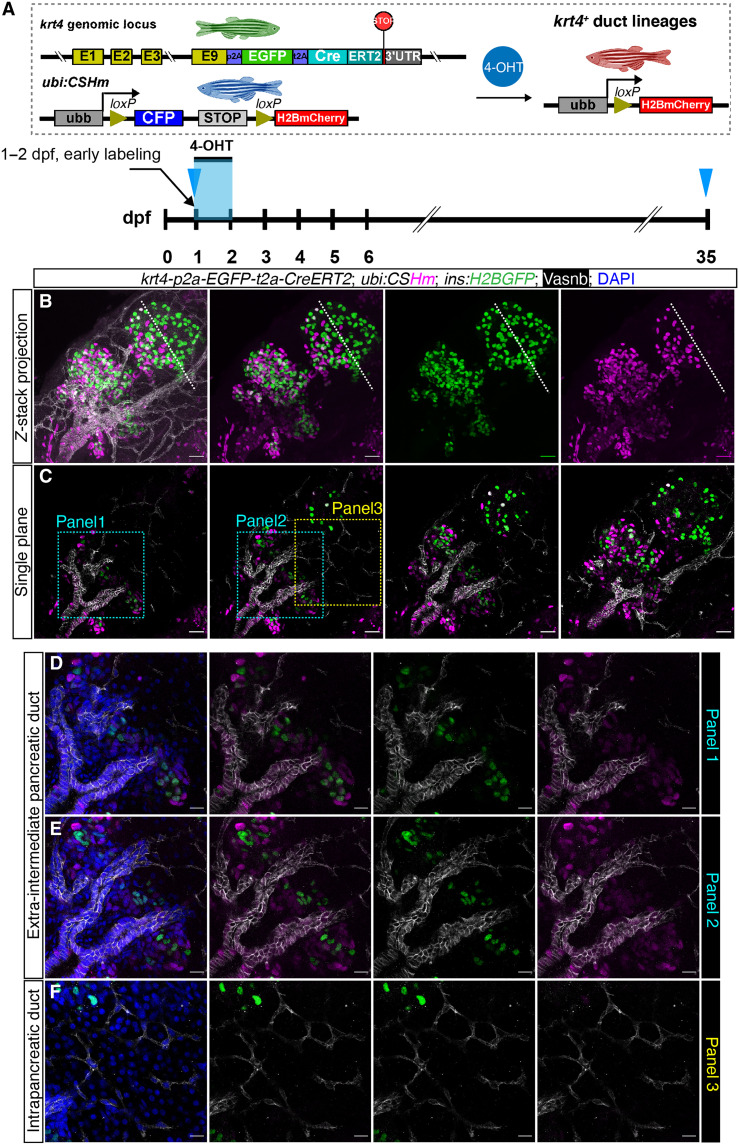
Image
Figure Caption

Fig. 4. Spatiotemporal-controlled lineage tracing of krt4+ ducts.

(A) Workflow of the Cre/loxP system used for spatiotemporal lineage tracing of krt4+ ductal cells. Fish carrying krt4-p2a-EGFP-t2a-CreERT2 (identified by green skin) are crossed to fish carrying ubi:CSHm transgenic lines (identified by blue skin). The 4-OHT is administered from 1 to 2 dpf, and we analyzed 35 dpf juvenile fish. (B) The maximum Z-projection of confocal images showing the islets from TgKI(krt4:CreERT2);Tg(ins:H2BGFP);Tg(ins:CSHm) line stained with Vasnb antibody (white) and 4′,6-diamidino-2-phenylindole (DAPI). All β cells are displayed with green fluorescence (from the ins:H2BGFP transgene) in the nucleus, and krt4-derived endocrine and ductal cells that can be traced back to krt4+ duct origin expressed H2BmCherry. Notably, the luminal duct in the pancreatic tail and Notch-responsive ductal cells are devoid of H2BmCherry. The fluorescence in krt4+ ducts is not visible because of its low intensity and the used confocal microscopy setting. (C to F) Single-plane confocal images showing the labeling pattern in three different layers/regions, with the cyan and yellow outlined regions (C) magnified in (D) to (F). Scale bars, 80 μm [(B) and (C)] and 40 μm [(D) to (F)].

Acknowledgments
This image is the copyrighted work of the attributed author or publisher, and ZFIN has permission only to display this image to its users. Additional permissions should be obtained from the applicable author or publisher of the image. Full text @ Sci Adv