
IMAGE
Figure 2
- ID
- ZDB-IMAGE-230821-2
- Publication
- Yang et al., 2023 - Influence of two anti-tumor drugs, pazopanib, and axitinib, on the development and thyroid-axis of zebrafish (Danio rerio) embryos/larvae
- All Figures
- Figures for Yang et al., 2023
Image
|
Figure Caption
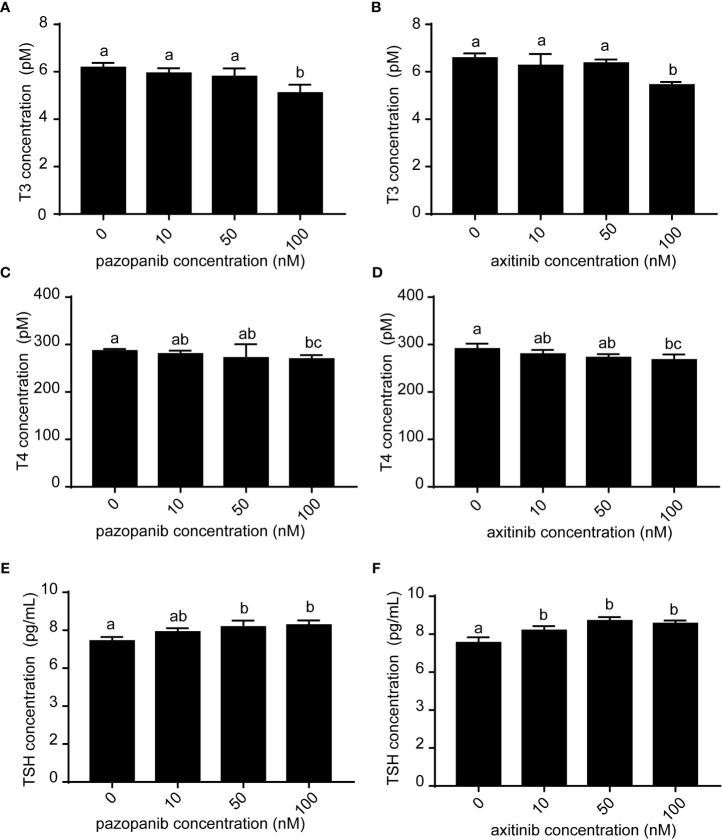
Figure 2
Levels of T3, T4, and TSH in zebrafish embryos following exposure to different concentrations (0, 10, 50, 100 nM) of pazopanib and axitinib for 96 h.
Figure Data
Acknowledgments
This image is the copyrighted work of the attributed author or publisher, and
ZFIN has permission only to display this image to its users.
Additional permissions should be obtained from the applicable author or publisher of the image.
Full text @ Front Endocrinol (Lausanne)