
Image
|
Figure Caption
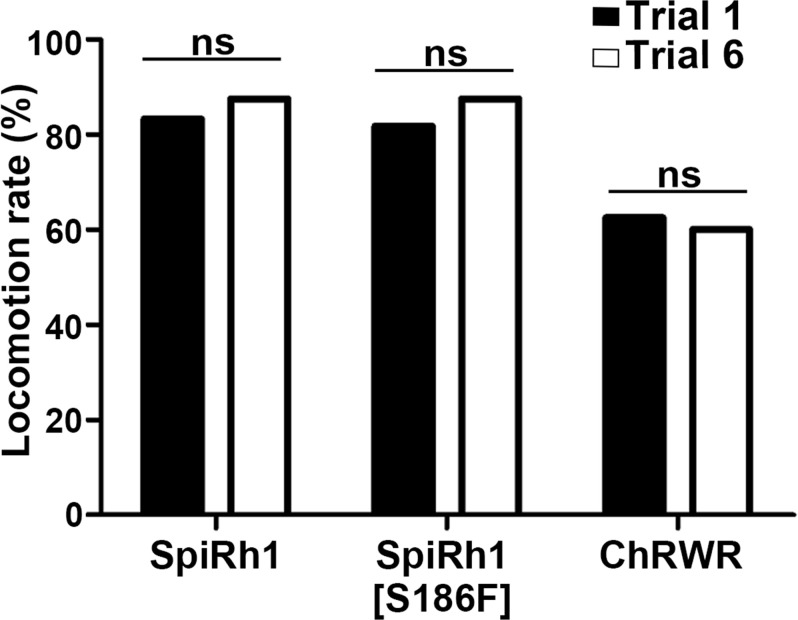
Figure 3—figure supplement 1 Effect of trial number on locomotion rate.
Locomotion rates in trials 1 and 6 are shown (n=12 for SpiRh1 and SpiRh1[S186F], n=8 for ChRWR). Means and SEMs are indicated. ns, not significant; one-way ANOVA with Tukey’s post hoc test.
Acknowledgments
This image is the copyrighted work of the attributed author or publisher, and
ZFIN has permission only to display this image to its users.
Additional permissions should be obtained from the applicable author or publisher of the image.
Full text @ Elife