Image
Figure Caption
Fig. 2
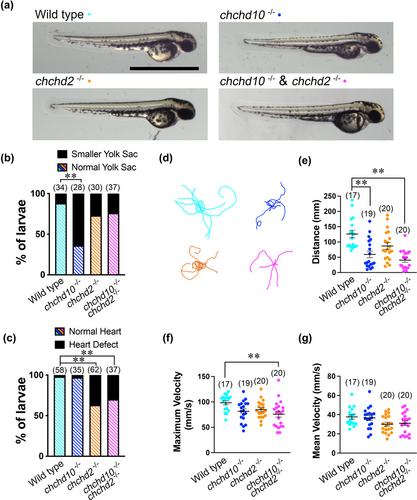
Larval chchd10−/−, chchd2−/−, and double chchd10−/− and chchd2−/− display morphological defects and motor impairment. (a) Representative images of 56 hpf larvae. (b) Quantification of yolk sacs defects. Larval chchd10−/− showing reduced yolk sack size compared to wild type larvae (p < .0001). (c) Quantification of heart defects. Both chchd2−/− (p < .0001) and double chchd10−/− and chchd2−/− (p < .0001) larvae display cardiac abnormalities. (d) Representative traces of touch-evoked motor response 2 dpf larvae (n = 10 per genotype). Quantification of swim distance with wild type larvae swimming for significantly longer distances than chchd10−/− (p = .0016) and double chchd10−/− and chchd2−/− (p = .0089) larvae (e). Quantification of maximum swim velocity revealed that wild type larvae swam at a maximum velocity that was significantly faster than double chchd10−/− and chchd2−/− (p = .0063) larvae (f). No differences were found when examining mean swim velocity across our genetic groupings (g). Data shown as individual data points ± SEM. Significance was assessed using Kruskal–Wallis test followed by Dunn's post hoc test for swimming distance or by one-way ANOVA and Tuckey's multiple comparison test for maximum velocity and mean distance measures. Significant differences from wild type larvae are represented by either a single asterisk (p < .05) or double asterisk (p < .01), and samples sizes (n) are in parentheses.
Acknowledgments
This image is the copyrighted work of the attributed author or publisher, and
ZFIN has permission only to display this image to its users.
Additional permissions should be obtained from the applicable author or publisher of the image.
Full text @ Dev. Neurobiol.

