IMAGE

Figure 5

ID
ZDB-IMAGE-230814-67
Source
Figures for Godino-Gimeno et al., 2023
Image
Figure Caption

Figure 5

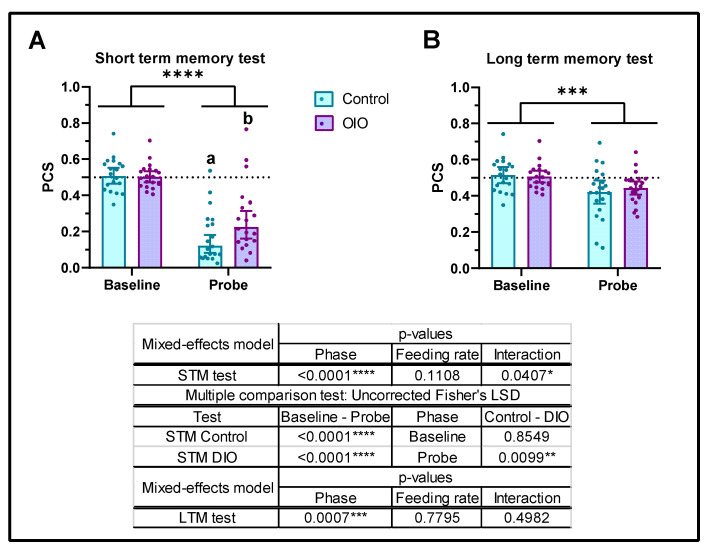
Effects of obesity on short- and long-term memory. (A) Short-term memory (STM) and (B) long-term memory (LTM). PCS, preference for conditioned stimulus. Data are represented by mean ± SEM. The dotted line indicates no stimulus preference (PCS = 0.5); low and high PCS mean less or more time spent in conditioned stimulus (CS), respectively. Results were analysed by repeated measures mixed-effect model and, when interaction was significant, uncorrected Fisher’s LSD test for multiple comparisons. Asterisks indicate significant differences between phases, baselines, and probes (* p ≤ 0.05, ** p ≤ 0.01, *** p ≤ 0.001, **** p ≤ 0.0001), and letters indicate significant differences between control and OIO probes.

Acknowledgments
This image is the copyrighted work of the attributed author or publisher, and ZFIN has permission only to display this image to its users. Additional permissions should be obtained from the applicable author or publisher of the image. Full text @ Int. J. Mol. Sci.