
IMAGE
Figure 5
- ID
- ZDB-IMAGE-230814-24
- Publication
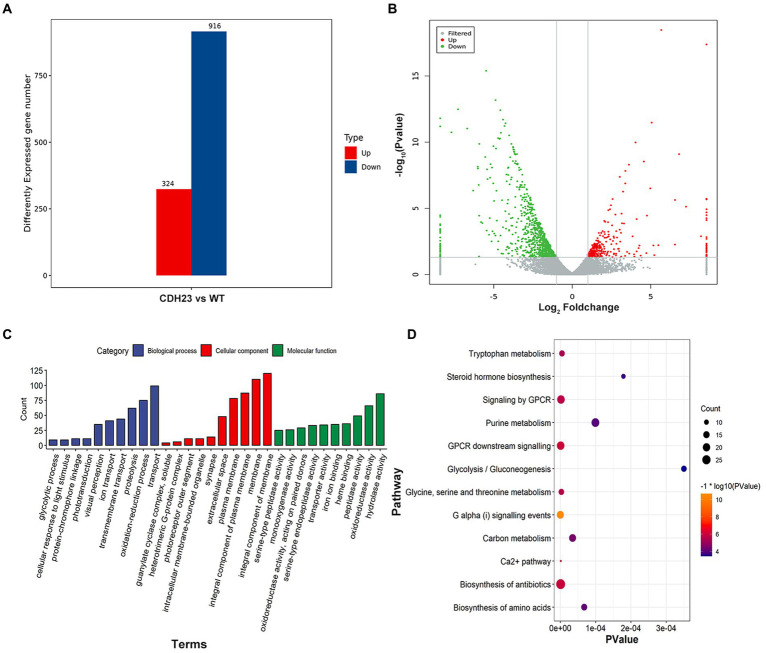
- Yang et al., 2023 - cdh23 affects congenital hearing loss through regulating purine metabolism
- All Figures
- Figures for Yang et al., 2023
Image
|
Figure Caption
Figure 5
Transcriptomics landscape with
Acknowledgments
This image is the copyrighted work of the attributed author or publisher, and
ZFIN has permission only to display this image to its users.
Additional permissions should be obtained from the applicable author or publisher of the image.
Full text @ Front. Mol. Neurosci.