IMAGE

Fig. 4.

ID
ZDB-IMAGE-230814-171
Source
Figures for Genuth et al., 2023
Image
Figure Caption

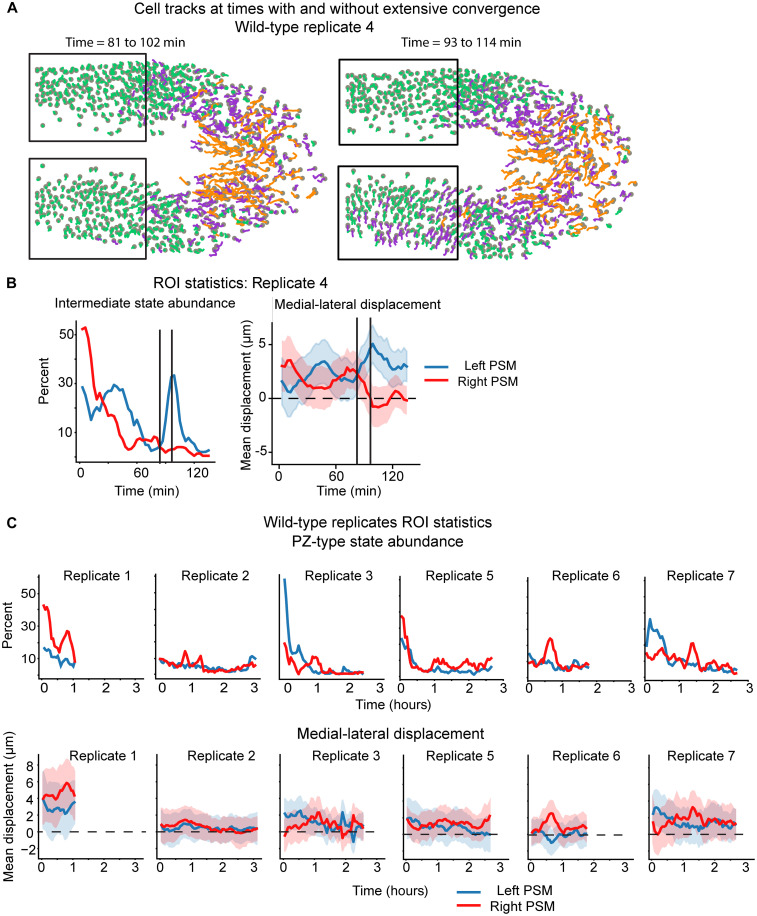
Fig. 4. PSM exhibits significant left-right asymmetry.

(A) Cell tracks in replicated four from two different times points plotted as in Fig. 3B. Boxes mark ROIs for left and right PSM region. (B) Track statistics for cells in left and right PSM ROIs in embryo shown in (A). The left plot is abundance of PZ-type tracks [magenta color in (A)] in the PSM over time. The right plot is track displacement along the medial-lateral axis (mean and SD) over time. Positive numbers are moving toward the midline. (C) PSM region ROI statistics for the other wild-type replicates. PSM convergent behavior differs markedly between embryos and between left and right sides within embryos.

Acknowledgments
This image is the copyrighted work of the attributed author or publisher, and ZFIN has permission only to display this image to its users. Additional permissions should be obtained from the applicable author or publisher of the image. Full text @ Sci Adv