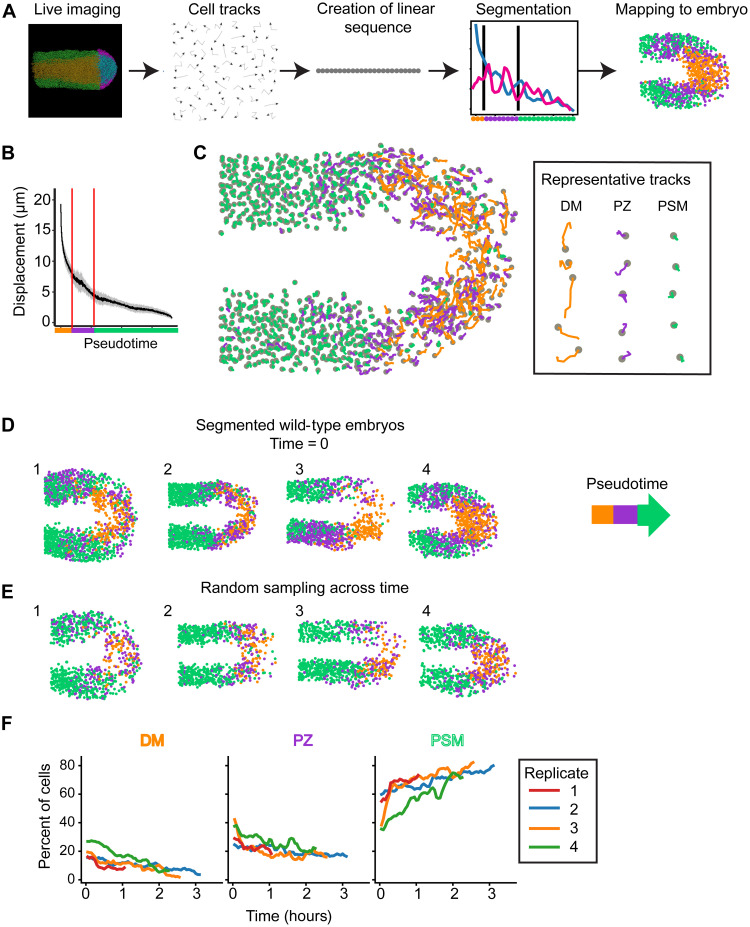
Fig. 3.
Cell motion states can be defined similarly to gene expression states.
(A) Schematic of experimental approach. Embryos were imaged with a confocal microscope, and cells were tracked. Tracks were arranged into a one-dimensional pseudotime sequence and then segmented. Last, they were mapped back onto the embryo. (B) Plot of track displacement over pseudotime. The line is the sliding window mean of 100 tracks, and shading is the SD. Vertical lines mark transitions between states. (C) Tracks mapped back onto the embryo. Tracks are colored by pseudotime segmentation. Gray circles mark cell positions at the end of the interval. Representative tracks were chosen at random. (D and E) Four segmented wild-type replicates. Dots represent position of the cells at the start of the track. Colors represent pseudotime segment. Tracks are either chosen from the start of the time lapse (D) or randomly sampled from throughout the time lapse (E). (F) Abundance of cell motion states in each replicate at each time point.
Acknowledgments
This image is the copyrighted work of the attributed author or publisher, and
ZFIN has permission only to display this image to its users.
Additional permissions should be obtained from the applicable author or publisher of the image.
Full text @ Sci Adv
Your Input Welcome
Thank you for submitting comments. Your input has been emailed to ZFIN curators who may contact you if
additional information is required.
Oops. Something went wrong. Please try again later.