IMAGE

Fig. 1.

ID
ZDB-IMAGE-230814-168
Source
Figures for Genuth et al., 2023
Image
Figure Caption

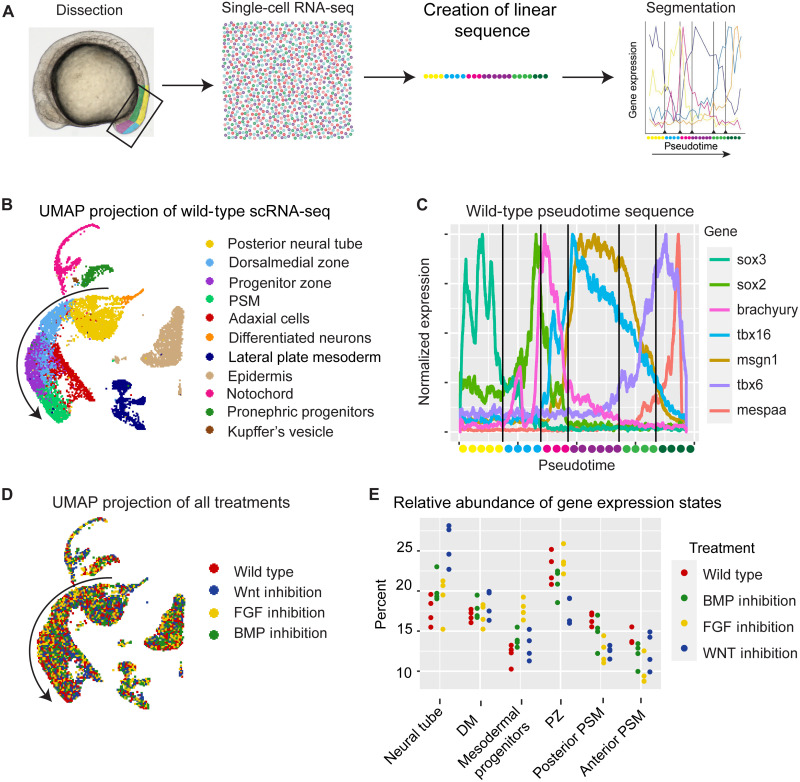
Fig. 1. Gene expression cell states in the zebrafish tailbud.

(A) Schematic of the experimental approach. Tailbuds were dissected and pooled; scRNA-seq profiles were generated, and a one-dimensional pseudotime was created and segmented into gene expression cell states. (B) UMAP projection of scRNA-seq data colored by cell type. Arrow marks the path of pseudotime in (C). (C) Expression of selected markers over pseudotime. Vertical lines are transition points between cell states as defined by a Bayesian algorithm that minimizes within state statistical error. Note that the segment colors along the pseudotime axis correspond to the colors along the developmental trajectory (arrow) in (B) but with the PZ and PSM being further subdivided into two similarly colored segments in (C). (D) UMAP projection of scRNA-seq data colored by experimental treatment. (E) Quantification of the differences in the proportion of cells that are in a given cell state in each replicate of each experimental condition. See also figs. S1 and S2.

Acknowledgments
This image is the copyrighted work of the attributed author or publisher, and ZFIN has permission only to display this image to its users. Additional permissions should be obtained from the applicable author or publisher of the image. Full text @ Sci Adv