
Fig. 4
- ID
- ZDB-IMAGE-230810-4
- Publication
- Yao et al., 2023 - DExH/D RNA helicase 15 regulates zebrafish intestinal development through the Wnt signaling pathway
- All Figures
- Figures for Yao et al., 2023
|
Fig. 4
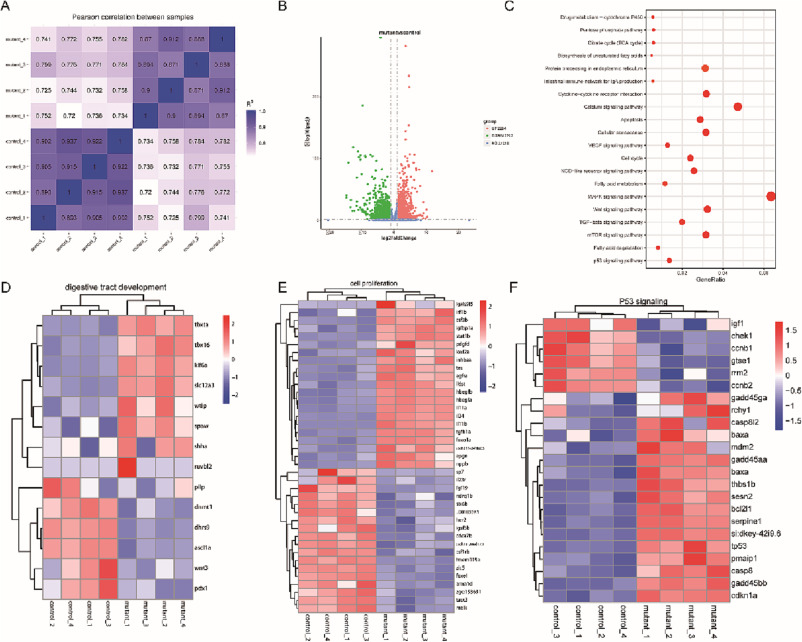
Fig. 4. RNA-seq genome wide analysis of dhx15+/+ and dhx15−/− zebrafish at 3.5 dpf. (A) The heat map of Pearson correlation analysis of two parallel experiments. The closer the correlation coefficient gets to 1, the better the repeatability between two parallel experiments it represents (B) Bioinformatics analysis of DEGs between dhx15+/+ and dhx15−/− zebrafish at 3.5 dpf. The red and green dots represent genes that are significantly up-regulated and down-regulated in the dhx15−/− embryos respectively. (C) GO analysis showed DEGs between dhx15+/+ and dhx15−/− zebrafish at 3.5 dpf. (D) Heat map analysis of the hierarchical clustering of DEGs in the development of the zebrafish digestive tract. (E) Heat map analysis of the hierarchical clustering of DEGs of in cell proliferation of in zebrafish. (F) Heat map analysis of the hierarchical clustering of DEGs of cell apoptosis of in zebrafish. DEGs: differentially expressed genes. (For interpretation of the references to colour in this figure legend, the reader is referred to the web version of this article.)