IMAGE

Figure 2

ID
ZDB-IMAGE-230731-44
Source
Figures for Drepanos et al., 2023
Image
Figure Caption

Figure 2

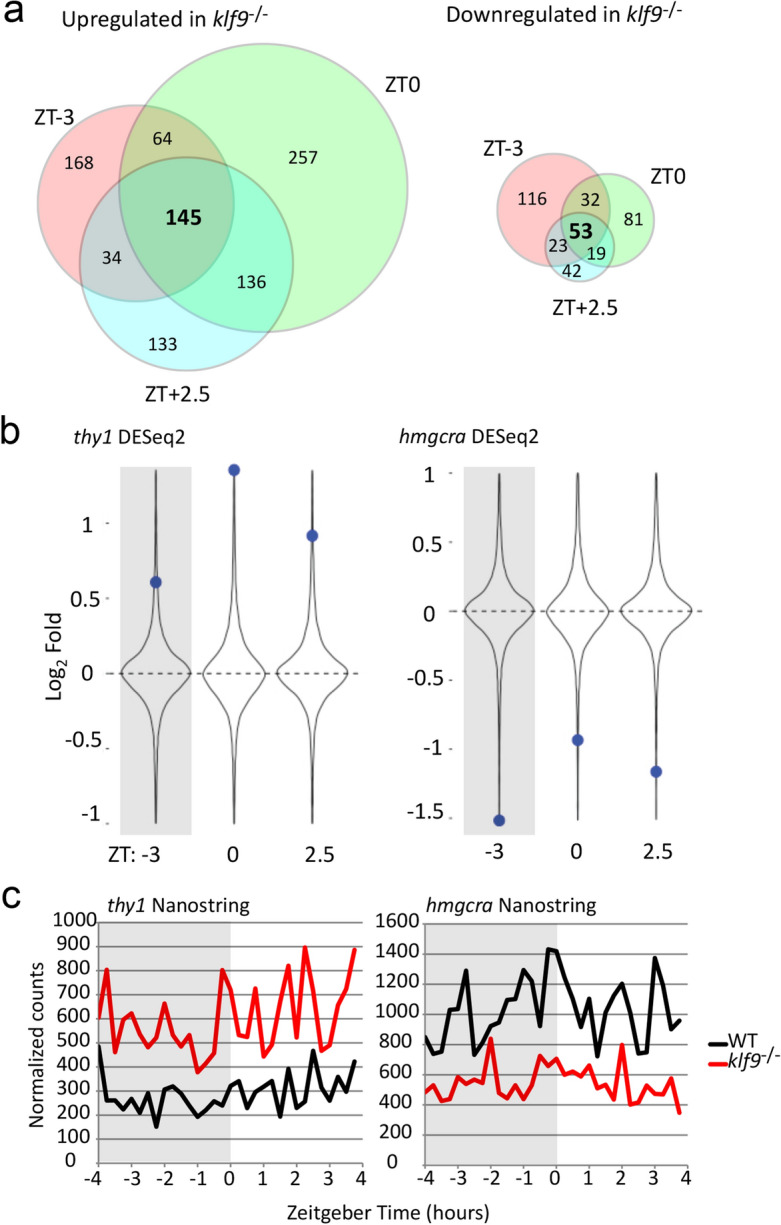
Loss of Klf9 function affects expression of some genes irrespective of time of day. (a) Venn diagrams (produced using Venny;54) showing numbers of genes found by DESeq2 to be differentially expressed (log2FC ≥ 0.5, FDR ≤ 0.1) between klf9−/− and wildtype larvae at each time point. (b) klf9−/− induced differential expression of thy1 and hmgcra with respect to DESeq2 distribution at each time point. In this and all following figures, the violin plot shows the distribution of values across all measured genes. (c) Nanostring analysis of thy1 and hmgcra expression with respect to time over an 8-h time course. Each sample consisted of total RNA pooled from 4–5 larvae collected at the indicated times on 5 dpf (see Gans et al., 2021, ref.17).

Acknowledgments
This image is the copyrighted work of the attributed author or publisher, and ZFIN has permission only to display this image to its users. Additional permissions should be obtained from the applicable author or publisher of the image. Full text @ Sci. Rep.