Figure Caption
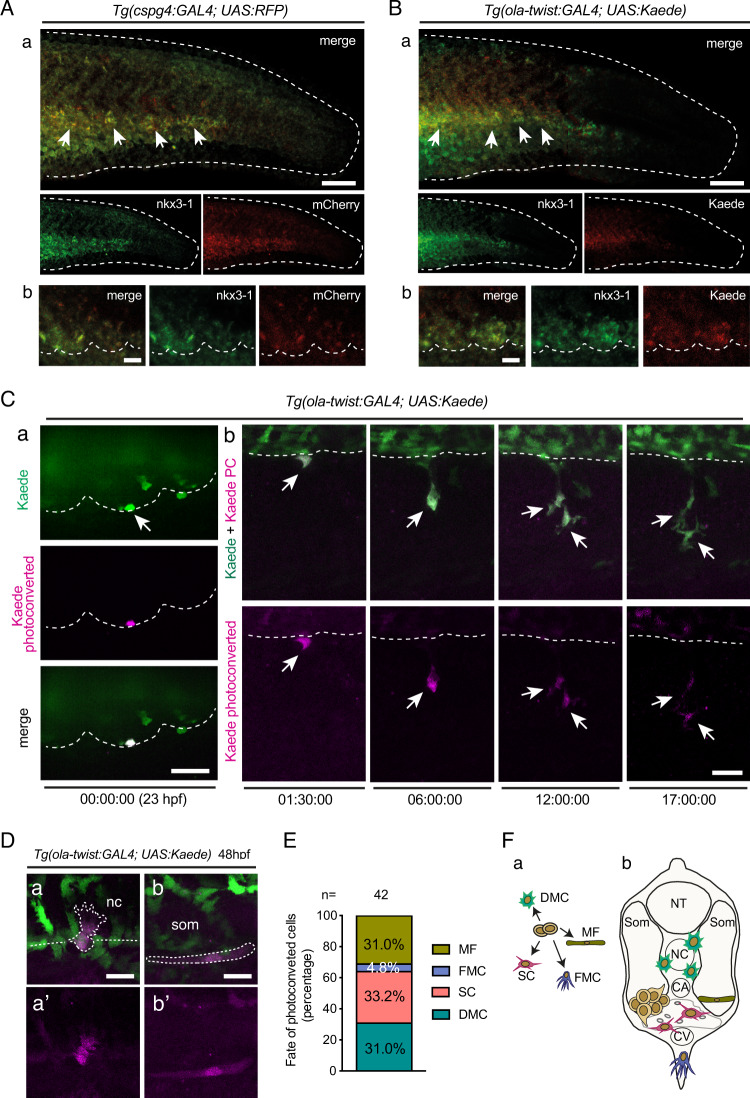
Somite VCs coincide with the sclerotome.A, B Tg(cspg4:Gal4; UAS:RFP) embryos (A) and Tg(ola-twist:Gal4; UAS:Kaede) embryos (B) were fixed at 24 hpf and subjected to double fluorescence WISH using probes for nkx3.1 and mCherry or Kaede mRNA, respectively. The entire tail area (a) and magnified images of the VCs (b) are shown; dashed line and arrows in a indicate the border of the caudal region and VC cells showing double staining. Dashed lines in b delineate the VC ventral borders. Scale bars, 100 µm in (a) and 20 µm in (b). C Confocal images of a live Tg(ola-twist:Gal4; UAS:Kaede) embryo. a a single Kaede(green)+ cell at the ventral border of an anterior caudal somite was photoconverted (magenta) at 23 hpf. b Representative frames from a time-lapse follow-up of the Kaede+ cell photoconverted in (a), which underwent mitosis at 10h15 (~33 hpf). Dashed line delineates the somite ventral border. Scale bars, 20 µm. D examples of photoconverted cells that migrated dorsalwards to the notochord (nc) (a, a’), or that differentiated in a muscle fiber at the somite ventral border (b, b’). Scale bars, 10 µm. E Histogram showing the percentage of each cell type differentiated at 48 hpf from single cells photoconverted at 23 hpf. Forty-two cells were analyzed from three independent experiments. F (a) Schematic representation of the developmental fates of photoconverted sclerotome cells; b localization of each derivative after migration. DMC dorsal mesenchymal cell, SC stromal cell, MF muscle fiber, FMC fin mesenchymal cell, NC notochord, NT neural tube, CA caudal artery, CV caudal vein, Som somite.

