
FIGURE 4
- ID
- ZDB-IMAGE-230724-41
- Publication
- Chi et al., 2023 - The interplay of common genetic variants NRG1 rs2439302 and RET rs2435357 increases the risk of developing Hirschsprung's disease
- All Figures
- Figures for Chi et al., 2023
|
FIGURE 4
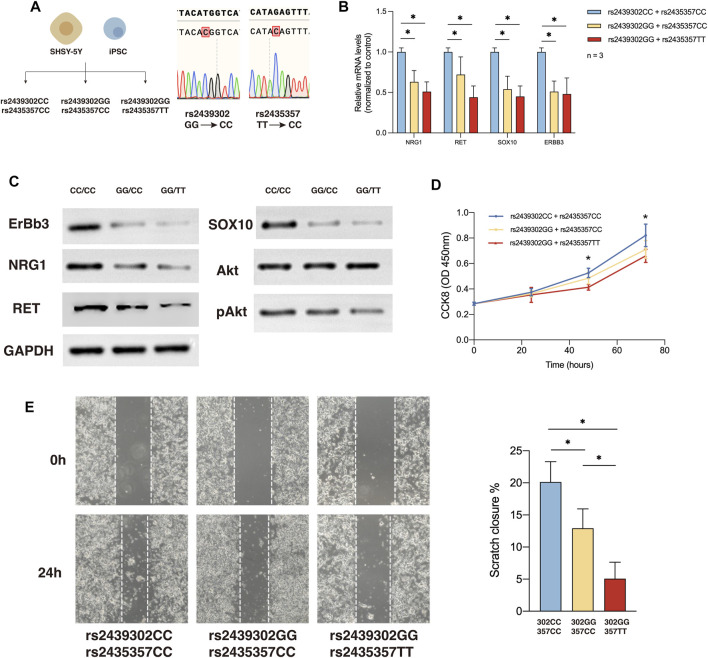
NRG1, RET, SOX10 expression, migration and proliferation ability of SHSY-5Y cells with different genotype. (A) Generation of rs2439302 CC/rs2435357 CC and rs2439302 GG/rs2435357 CC cell lines and confirmation by sanger sequencing. (B) qRT-PCR analysis of relative expression levels of NRG1, RET, SOX10, and ERBB3 in SHSY-5Y cells. (C) Western blot of protein expression levels of NRG1, RET, SOX10, ERBB3, Akt, pAkt, and GAPDH in SHSY-5Y cells. (D) Scratch assays showed that rs2439302 CC/rs2435357 CC SHSY-5Y cells retained the smallest scratch area. (E) CCK8 assay results of SHSY-5Y cells with different genotypes.