
IMAGE
FIGURE 2
- ID
- ZDB-IMAGE-230724-39
- Publication
- Chi et al., 2023 - The interplay of common genetic variants NRG1 rs2439302 and RET rs2435357 increases the risk of developing Hirschsprung's disease
- All Figures
- Figures for Chi et al., 2023
Image
|
Figure Caption
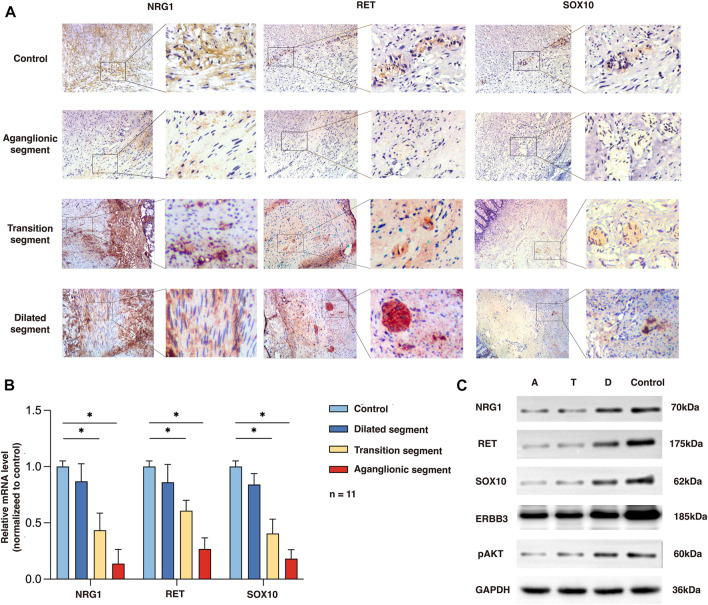
FIGURE 2
Expression of NRG1, RET, and SOX10 in the rs2439302 GG rs2435357 TT HSCR patients’ colon and control colon. (A) Immunochemistry staining in colon tissues for NRG1, RET, and SOX10. (B) qRT-PCR analysis of relative expression levels of NRG1, RET, and SOX10. (C) Western blot of protein expression levels of NRG1, RET, SOX10, ERBB3, pAKT, and GAPDH in aganglionic, transition, and dilated segments of HSCR patients and control.
Acknowledgments
This image is the copyrighted work of the attributed author or publisher, and
ZFIN has permission only to display this image to its users.
Additional permissions should be obtained from the applicable author or publisher of the image.
Full text @ Front Cell Dev Biol