
Fig. 5
- ID
- ZDB-IMAGE-230721-44
- Publication
- de Prisco et al., 2023 - Alternative polyadenylation alters protein dosage by switching between intronic and 3'UTR sites
- All Figures
- Figures for de Prisco et al., 2023
|
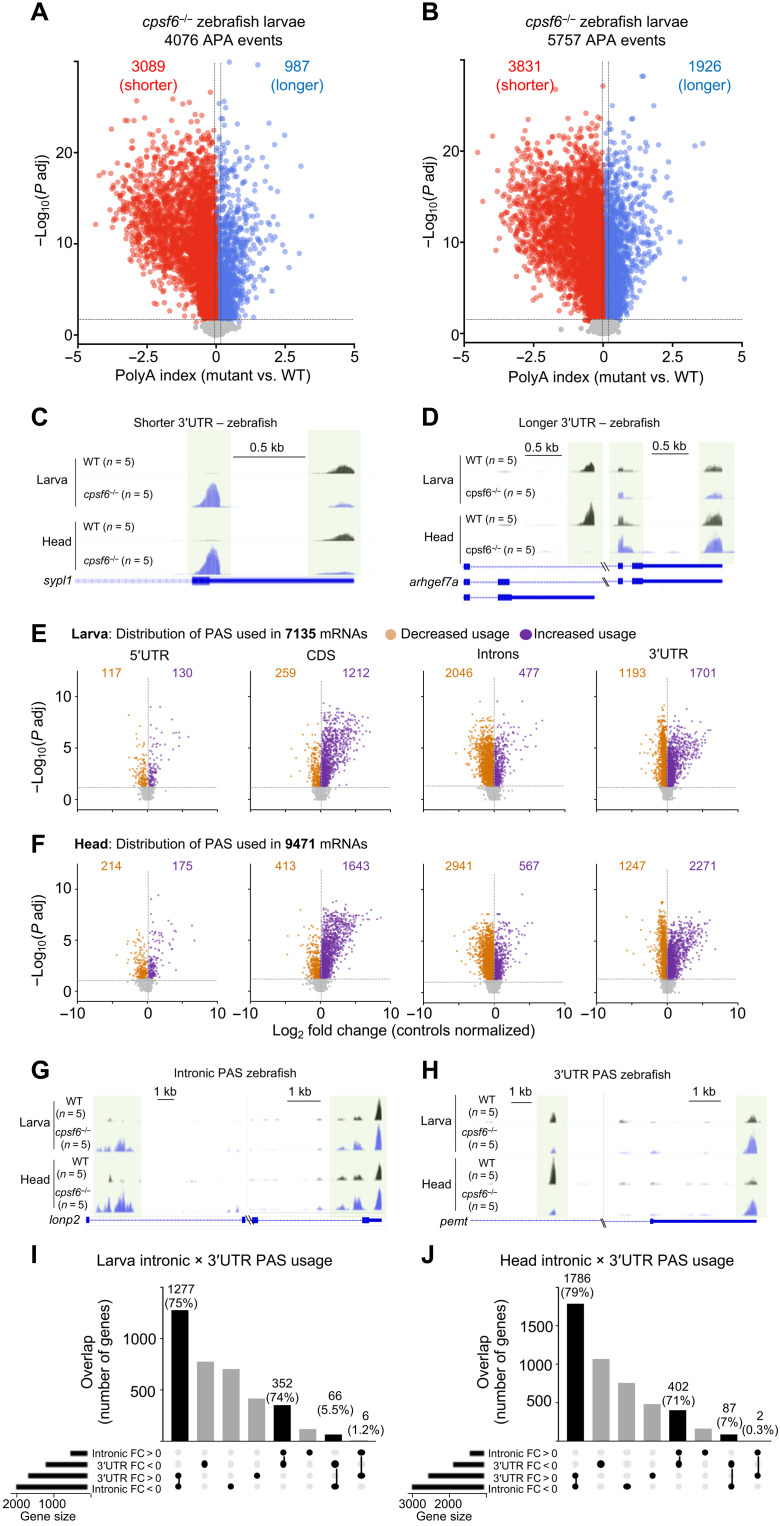
Fig. 5
(A and B) Volcano plots show APA change in cpsf6−/− larvae (A) and heads (B) compared to WT age-matched siblings. The horizontal and vertical dashed lines in (A) and (B) indicate the −log10 (P adjusted) ≥ 1.325 (P adjusted ≤ 0.05) and polyA index ≥+0.1 and ≤−0.1, respectively. (C and D) Representative IGV tracks for shorter (C) and longer (D) 3′UTRs. Light green boxes highlight the polyA site used. (E and F) Volcano plots showing the polyA read distribution in 5′UTR, CDS, introns, and 3′UTR from cpsf6−/− larvae (E) and heads (F), compared to WT stage-matched larvae and heads, respectively. Each dot represents a transcript with greater (purple, log2 FC > 0) or lesser (orange, log2 FC < 0) PAS usage in a certain location. The horizontal and vertical dashed lines in (E) and (F) indicate the −log10 (P adjusted) ≥ 1.325 (P adjusted ≤ 0.05) and the log2 FC, respectively. (G and H) Representative IGV tracks for intronic PAS usage (G) and 3′UTR PAS usage (H). (I) In cpsf6−/− larvae, 75% of the mRNA undergoing 3′UTR APA in mutant underwent intronic APA WT, while 74% switch in the other direction. (J) In cpsf6−/− heads, 79% of mRNA that had 3′UTR APA underwent intronic APA in controls, and 71% switch from intronic to 3′UTR APA in controls. PAC-seq was performed on 10 (five larvae and five heads) independently collected groups of cpsf6−/− compared to 10 WT stage-matched animals. Each group of animals was composed of 30 to 40 larvae or 40 to 50 heads.