
Image
|
Figure Caption
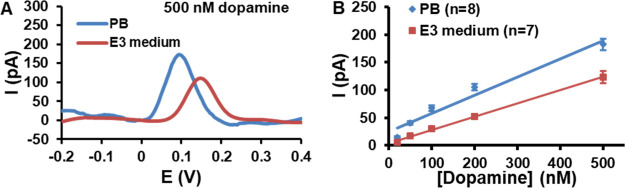
Fig. 4
(A) Comparative response of pretreated CFMEs to 500 nM dopamine in PB and E3 medium. (B) Calibration curves for dopamine detection at pretreated CFMEs recorded in PB (R2 = 0.963) and E3 medium (R2 = 0.998). The signal showed is the average response measured for the varied concentrations of dopamine by DPV (4 mV potential increment, 50 mV pulse amplitude, 50 ms pulse width, and 200 ms pulse period). The error bars represent the standard error of the mean for “n” replicate experiments.
Acknowledgments
This image is the copyrighted work of the attributed author or publisher, and
ZFIN has permission only to display this image to its users.
Additional permissions should be obtained from the applicable author or publisher of the image.
Full text @ ACS Meas Sci Au