
Image
|
Figure Caption
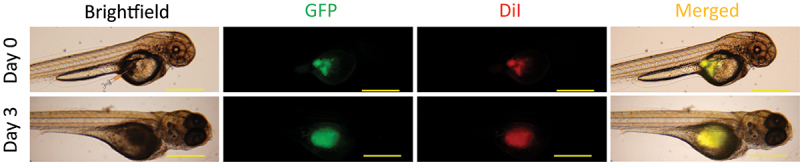
Figure 1.
Schematic of zebrafish xenograft assay. Representative brightfield and fluorescent images of zebrafish injected with GFP-expressing DiI labeled MDA-MB-231 cells and their overlay on Day 0 and Day 3 after the injection. The cells were injected into the yolk sac of 2 dpf zebrafish, as illustrated on the brightfield image for Day 0. Scale bar = 500 μm.
Acknowledgments
This image is the copyrighted work of the attributed author or publisher, and
ZFIN has permission only to display this image to its users.
Additional permissions should be obtained from the applicable author or publisher of the image.
Full text @ Cancer Biol. Ther.