
|
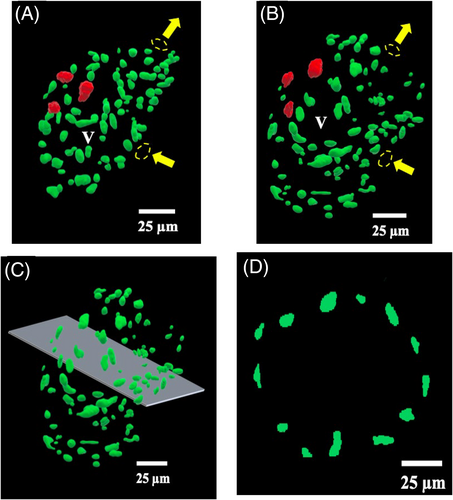
Fig. 2 Representative selective plane illumination microscopy (SPIM) images of 4-dpf Tg (cmlc2: eGFP − nuc) zebrafish heart showing ventricular cardiomyocyte nuclei: (A) at the start of filling (end of isovolumic relaxation), (B) at end-diastole (ED or the end of filling). Nuclei used as deformation analysis markers are indicated in red, and yellow arrows indicate the inflow through atrio-ventricular (AV) valve and the outflow through ventriculo-bulbar (VB) valve, V denotes ventricle. (C) A plane cut through the equatorial (EQ) region of the ventricle at ED state to reveal the transverse cross-section of the ventricular wall as a single-cell myocardial wall shown in (D)