
IMAGE
Figure 3
- ID
- ZDB-IMAGE-230719-3
- Genes
- Publication
- Vaz et al., 2023 - Loss of ctnnd2b affects neuronal differentiation and behavior in zebrafish
- All Figures
- Figures for Vaz et al., 2023
Image
|
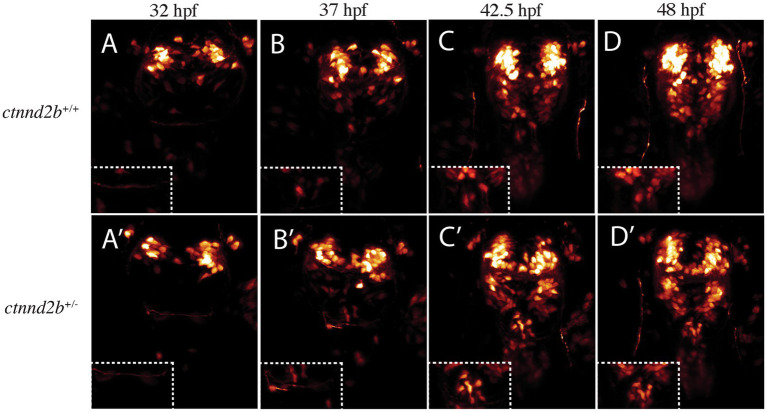
Figure Caption
Figure 3
Increase in Isl1-positive cells is likely due to misspecification rather than migration defects. 3D renders of timelapse imaged
Figure Data
Acknowledgments
This image is the copyrighted work of the attributed author or publisher, and
ZFIN has permission only to display this image to its users.
Additional permissions should be obtained from the applicable author or publisher of the image.
Full text @ Front. Neurosci.