
Image
|
Figure Caption
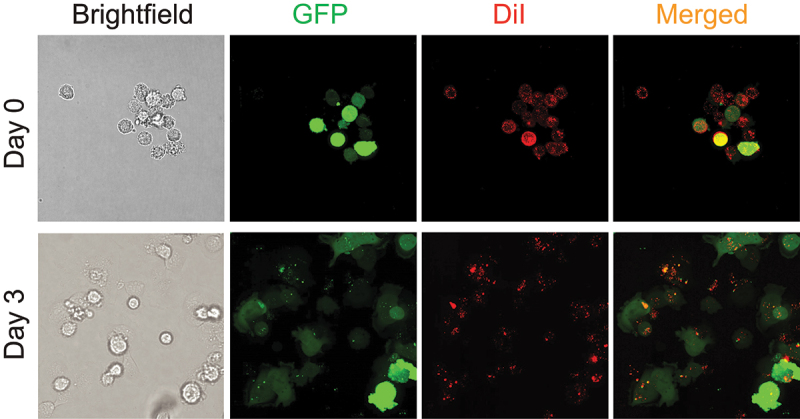
Figure 5.
Imaging of GFP fluorescence and DiI labeling of MDA-MB-231 cell cultures. Representative brightfield and GFP, DiI and merged fluorescence images of the MDA-MB-231 cells on Day 0 and Day 3 of the experiment.
Acknowledgments
This image is the copyrighted work of the attributed author or publisher, and
ZFIN has permission only to display this image to its users.
Additional permissions should be obtained from the applicable author or publisher of the image.
Full text @ Cancer Biol. Ther.