
|
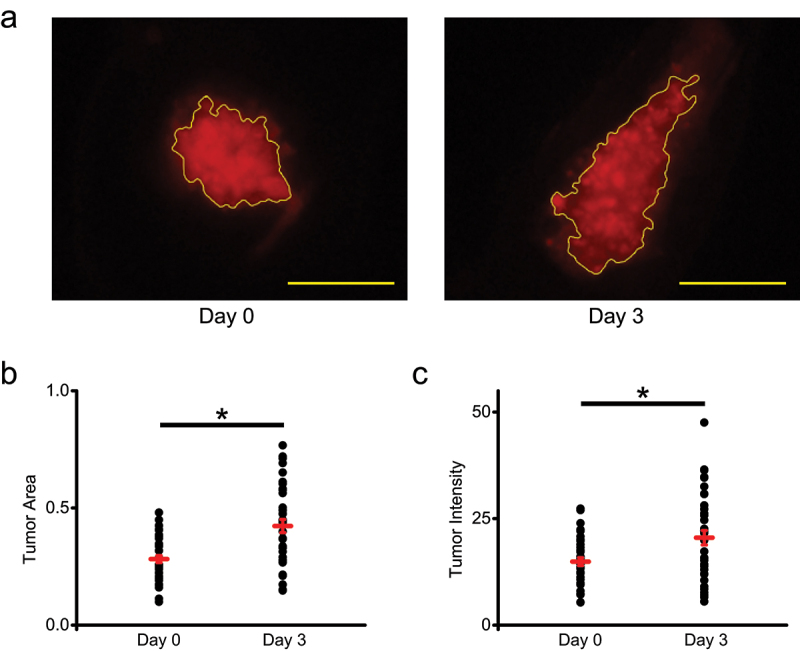
Figure 3.
DiI labeling of zebrafish xenografts of GFP-expressing and DiI labeled MDA-MB-231 cells. (a) Representative image of a zebrafish xenograft tumor area outlined in yellow based on the DiI labeling on Day 0 and Day 3 post-injection into 2pdf zebrafish embryos. Scale bar = 50 μm. (b) Quantification of tumor area based on the DiI labeling on Day 0 and Day 3. Average tumor area was 0.28 ± 0.01 on Day 0 and 0.42 + 0.03 on Day 3 (