IMAGE

Fig.4

ID
ZDB-IMAGE-230717-98
Source
Figures for Quadri et al., 2023
Image
Figure Caption

Fig.4

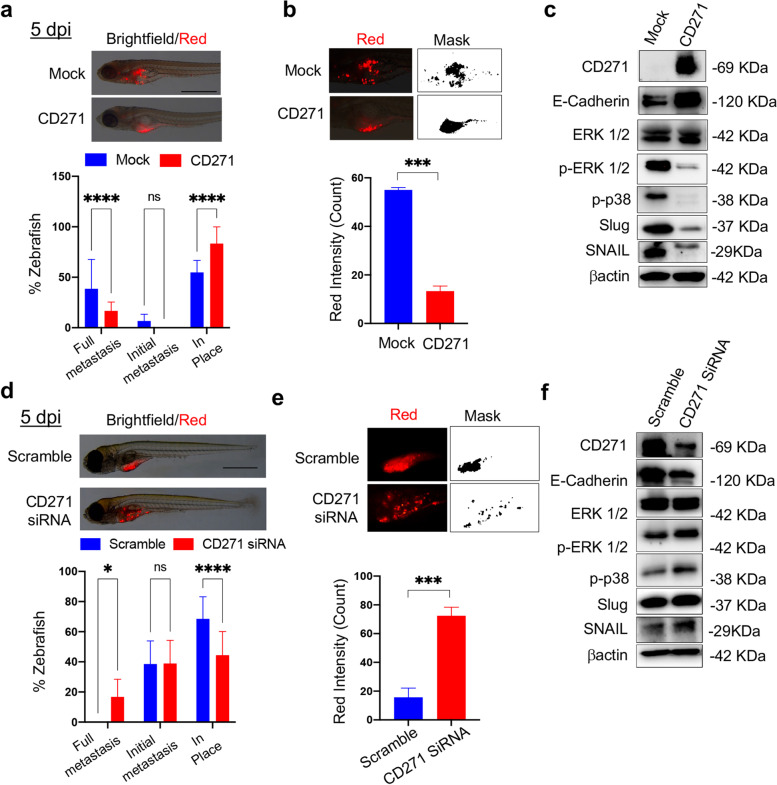
CD271 expression abolishes cSCC metastasis in zebrafish a Above panel: Zebrafish injected with mock or CD271-overexpressing fluorescent stained SCC13 cells (red; about 50 cells/embryo) at 5 dpi (day post-injection). Scale bar = 500 µm. Bottom panel: Metastases were quantified and classified as Full metastases, Initial metastases, and In place. b Above panel: Representative detail of fluorescent cSCC cells (red) and ImageJ mask. Bottom panel: Quantification of the red fluorescent intensity of cell mass in zebrafish by ImageJ software. c Expression of CD271, E-Cadherin, ERK1/2, pERK1/2, p-p38, Slug and Snail in cell injected into zebrafish. βactin was used as loading control. d Above panel: Zebrafish injected with scramble or CD271-silenced fluorescent stained SCC13 cells (red; about 50 cells/embryo) at 5 dpi (day post-injection). Scale bar = 500 µm. Bottom panel: Metastasis quantification as in (a). e Above panel: Representative detail of fluorescent cSCC cells in red and ImageJ mask. Bottom panel: quantification of the red fluorescent intensity of cell mass in zebrafish by ImageJ software. f Expression of CD271, E-Cadherin, ERK1/2, pERK1/2, p-p38, Slug and Snail in cell injected into zebrafish. βactin was used as loading control. Results are shown as the mean percentage of three independent experiments and a minimum of 20 injected zebrafish for each condition was used. Statistical analysis was performed using the two-way ANOVA and multiparametric T-test. *0.01 < p < 0.05, ***0.0001 < p < 0.001, ****p < 0.0001

Acknowledgments
This image is the copyrighted work of the attributed author or publisher, and ZFIN has permission only to display this image to its users. Additional permissions should be obtained from the applicable author or publisher of the image. Full text @ J. Exp. Clin. Cancer Res.