
|
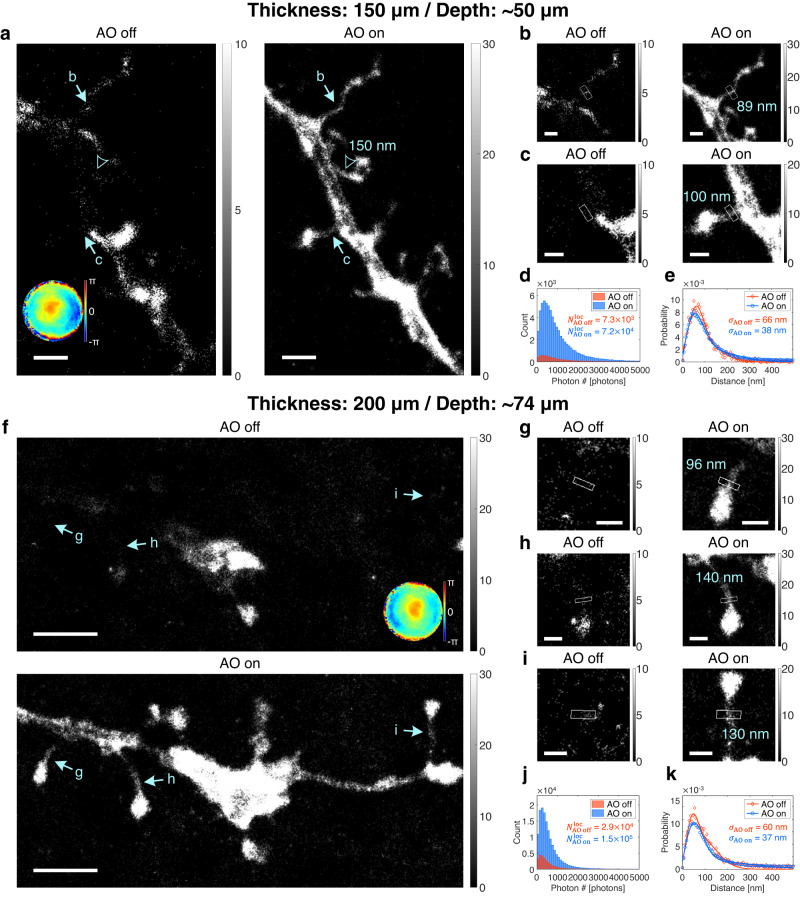
Fig. 3
a SMLM images of dendritic spines at the depth of 50 μm in a 150-μm-thick mouse brain slice without and with AO. Bottom-left inset in AO-off image shows aberration correction map. The FWHM value of a dendritic spine neck is indicated by an arrowhead. Color bars indicate localization numbers. Scale bars indicate 2 μm. b, c Magnified views of regions indicated by arrows in (a). FWHM values of dendritic spine necks (white boxes) are written in AO-on images. Color bars indicate localization numbers. Scale bars indicate 500 nm. d, e Histograms of photon number per emission PSF (d) and nearest neighbor analysis results (e) of (a). f SMLM images of dendritic spines at the depth of 74 μm in a 200-μm-thick mouse brain slice without and with AO. Top-left inset in AO-off image shows aberration correction map. Color bars indicate localization numbers. Scale bars indicate 2.5 μm. g–i Magnified views of regions indicated by arrows in (f). FWHM values of dendritic spine necks (white boxes) are written in AO-on images. Color bars indicate localization numbers. Scale bars indicate 500 nm. j, k Histograms of photon number per emission PSF (j) and nearest neighbor analysis results (k) of (f). Source data are provided as a Source Data file.