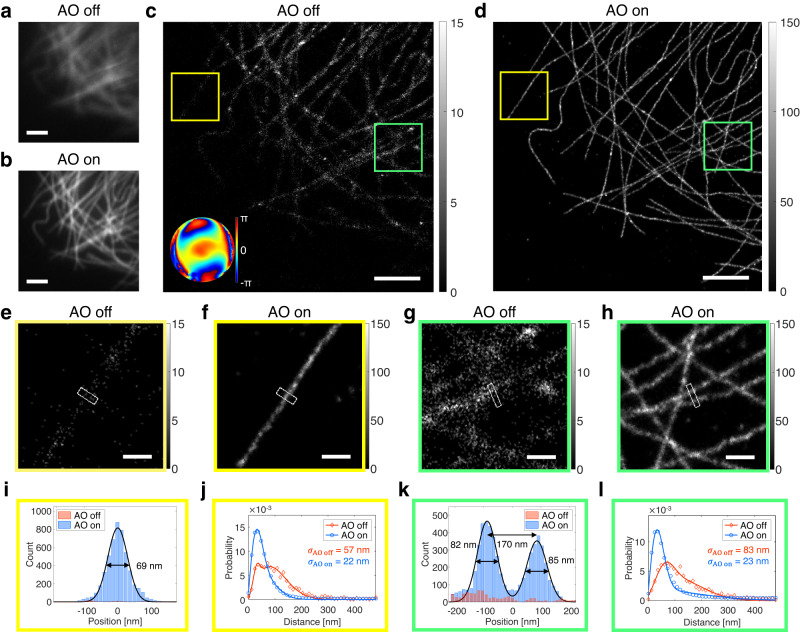
IMAGE

Fig. 2

ID
ZDB-IMAGE-230717-104
Source
Figures for Park et al., 2023
Image
Figure Caption

Fig. 2 Demonstration of AO-SMLM in a COS-7 cell with an aberration layer.

a, b Diffraction-limited fluorescence images without (a) and with (b) AO, respectively. Images are normalized with respect to AO on. Scale bars indicate 2.5 μm. c, d SMLM images without (c) and with (d) AO, respectively. Inset in (c) indicates the aberration correction map. Color bars indicate localization numbers. Scale bars indicate 2.5 μm. eh Magnified views of the yellow and green boxes in (c, d), respectively. Color bars indicate localization numbers. Scale bars indicate 500 nm. i Cross-sectional profiles of white boxes in (e, f). j Nearest neighbor analysis results for the yellow boxes in (c, d) and other areas where single microtubules were isolated. k Cross-sectional profiles of white boxes in (g, h). l Nearest neighbor analysis results for the green boxes in (c, d) and other areas where microtubules were confluent. Source data are provided as a Source Data file.

Acknowledgments
This image is the copyrighted work of the attributed author or publisher, and ZFIN has permission only to display this image to its users. Additional permissions should be obtained from the applicable author or publisher of the image. Full text @ Nat. Commun.