
|
Fig. 4
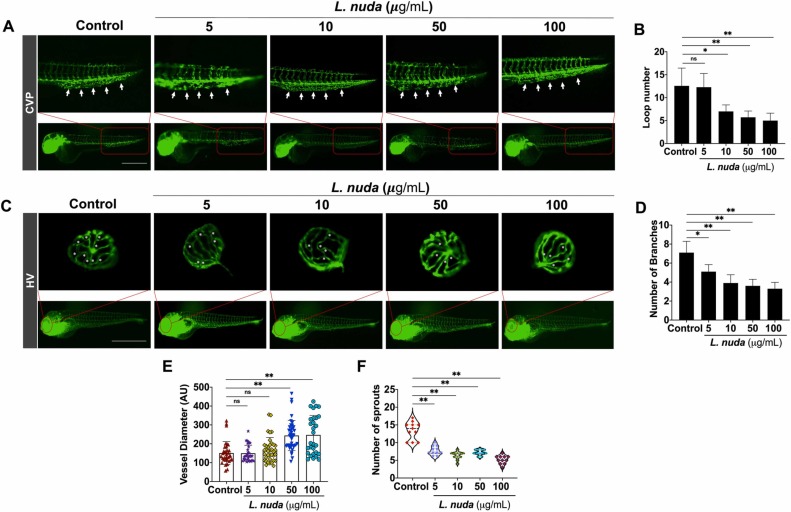
Fig. 4. : Representative and quantitative results of CVP and HV development and the impact of L. nuda extract treatment. (A) The CVP development evaluation shows inhibition of CVP growth and defective and unorganized loops observed following L. nuda treatment. White arrows indicate the locations of the CVP loops. (B) Quantitative results show that L. nuda treatment significantly reduced the number of CVP loops compared to the untreated/control group. (C) HV development evaluated by fluorescence imaging showed a significant effect of L. nuda treatment. White asterisk indicates HV branching. (D-F) Quantification of HV branching, diameter, and sprouting showed significant changes in control and L. nuda (5–100 μg/mL)-treated embryos at 6 dpf. * p < 0.05, * * p < 0.001; Scale bar = 100 µm.