
|
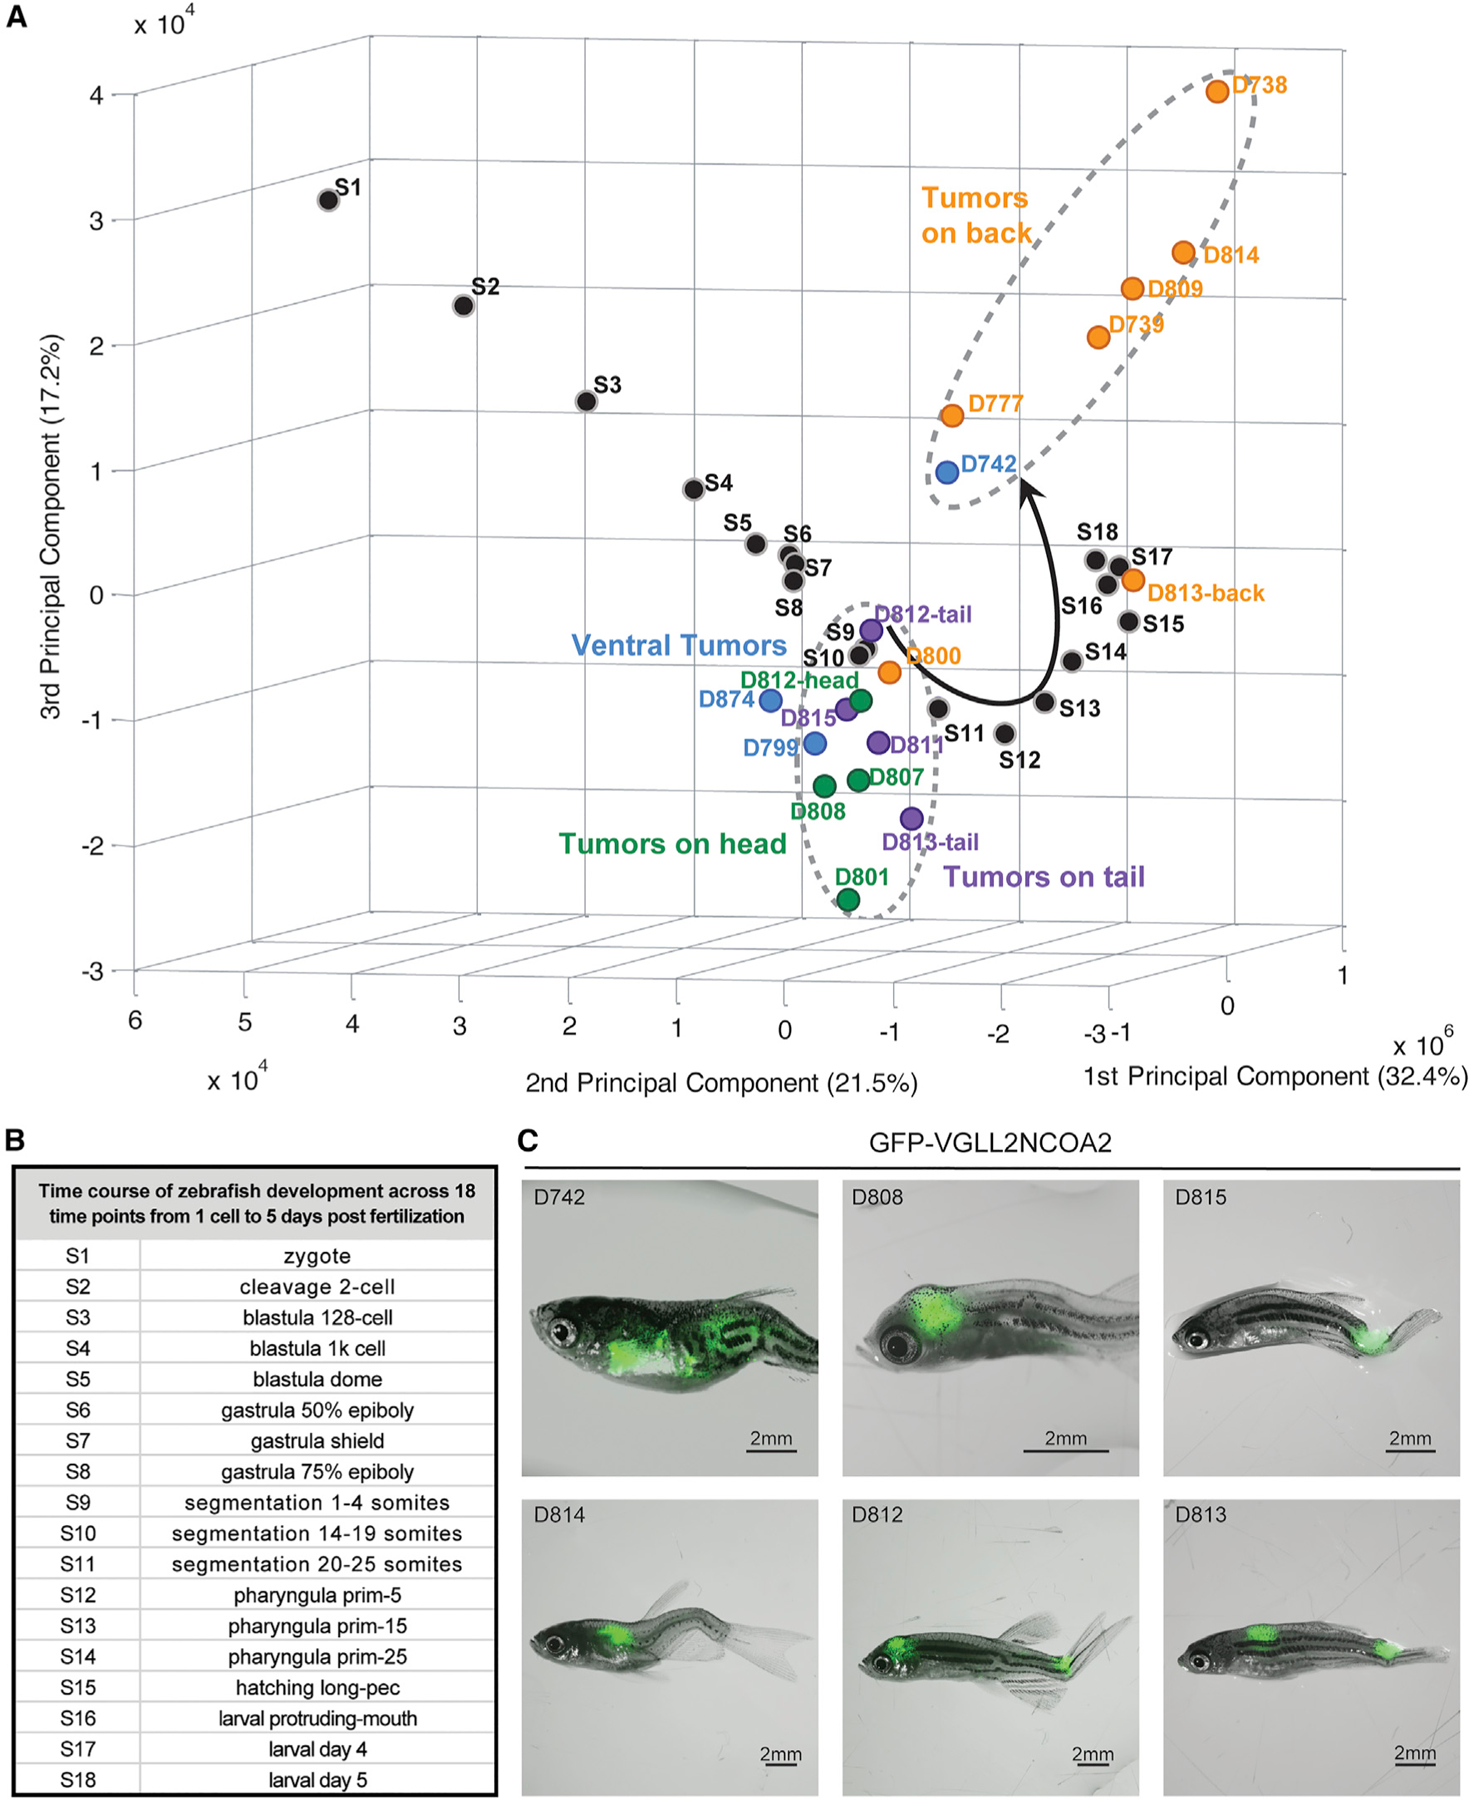
Fig. 3
(A) Principal-component analysis (PCA) of RNA-seq data of zebrafish development time points from White et al. 26 and VGLL2-NCOA2 zebrafish tumors from this study. All FASTQ files were processed by the same computational pipeline to minimize computational batch effects. Colors indicate location of the tumor on the fish: back tumors in orange, ventral tumors in blue, head tumors in green, and tail tumors in purple. In the PCA, principal component 1 (PC1) describes the most variance but is presented to appreciate differences in PC2, which best discriminates tumor cohorts.
(B) Embryonic stages labeled as per the Zebrafish Information Network (ZFIN).
(C) Brightfield and GFP overlaid images of a subset of the VGLL2-NCOA2 tumors used in (A). Scale bars, 2 mm.