
|
Fig. 6
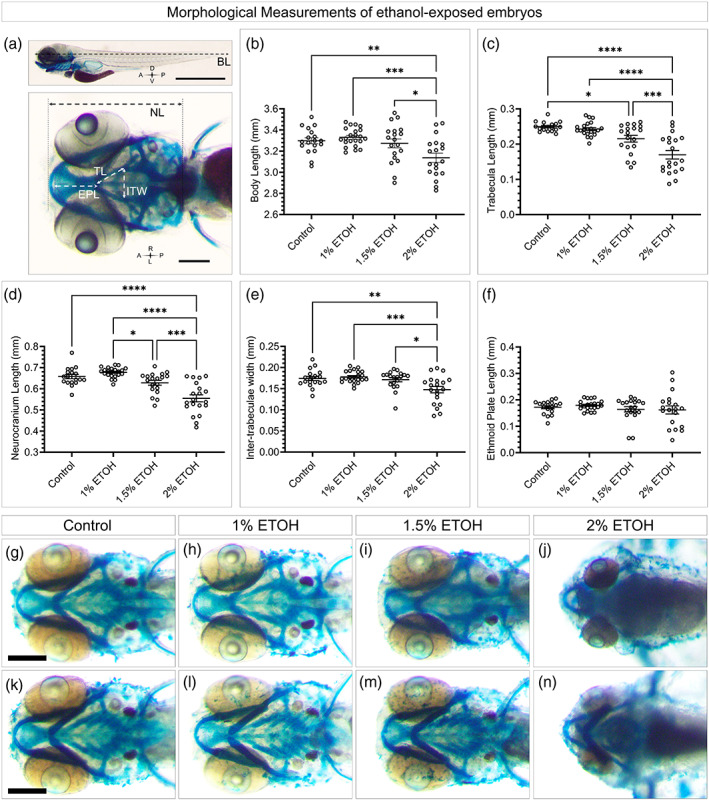
Ethanol exposure causes dose‐dependent craniofacial defects. (a, top) Schematic showing lateral view of whole embryo for body length (BL) measurement. Scale bar = 1 mm (a, bottom) Schematic showing dorsal view of 5 dpf embryo showing neurocranium length (NL), Trabecula Length (TL), Inter‐trabuculae width (ITW), and ethmoid plate length (EPL). Scale bar = 0.2 mm. (b–f) Column graphs showing each embryo's morphological measurement for each endpoint. Black bars show mean measurement for each group ± SEM. Statistics: two‐tailed ANOVA with Tukey's multiple comparison's correction between all groups. * = p < .05, ** = p < .01, *** = p < .001, **** p < .0001. (g‐j) Representative (based on TL measurement) dorsal or (k‐n) ventral images of 5 dpf bone and cartilage stained embryos for control or the indicated concentration of ethanol show increasing severity of craniofacial malformations with ethanol dose. ETOH = ethanol