
Image
|
Figure Caption
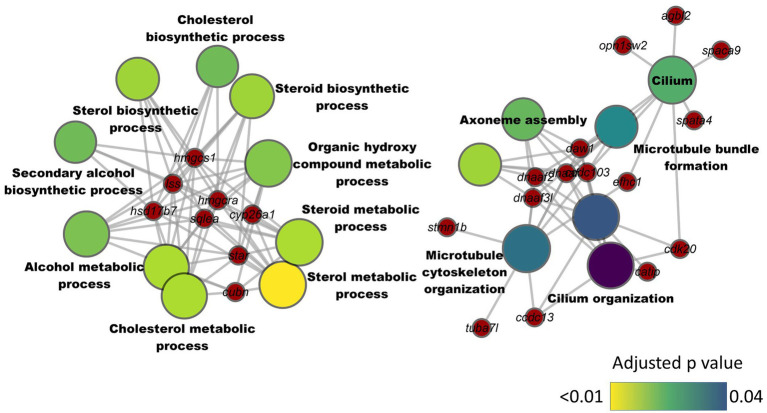
Figure 5
Network plot showing the link between enriched GO terms and the associated genes that were downregulated in the intestine of zebrafish fed high cholesterol diet. The significantly downregulated genes from the HC vs. CT comparison are written on the red nodes. Only the non-redundant GO terms are labelled in the network plot. For each GO term, the gradient color varies with the adjusted
Acknowledgments
This image is the copyrighted work of the attributed author or publisher, and
ZFIN has permission only to display this image to its users.
Additional permissions should be obtained from the applicable author or publisher of the image.
Full text @ Front Nutr