IMAGE

Figure 3

ID
ZDB-IMAGE-230712-17
Source
Figures for Gora et al., 2023
Image
Figure Caption

Figure 3

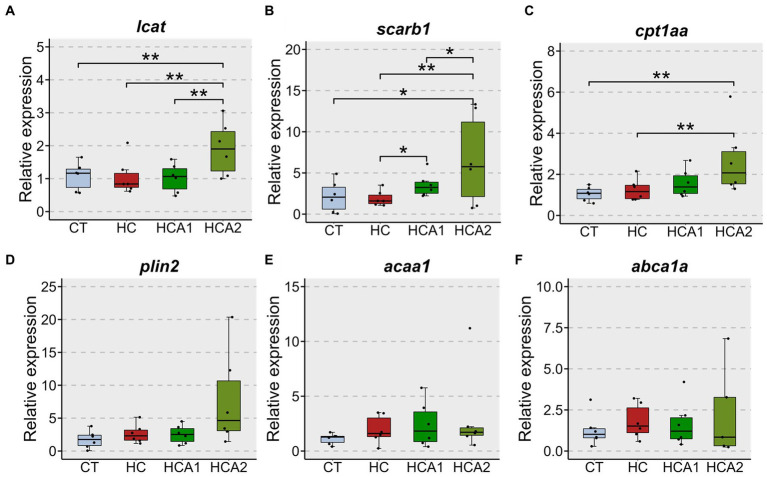
Relative expression of selected genes in the liver of zebrafish fed different experimental diets. lecithin-cholesterol acyltransferase (lcat) (A); scavenger receptor class B, member 1 (scarb1) (B); carnitine palmitoyltransferase 1Aa (cpt1aa) (C); perilipin 2 (plin2) (D); acetyl-CoA acyltransferase 1 (acaa1) (E); ATP-binding cassette, sub-family A (ABC1), member 1A (abca1a) (F). Black dots indicate the relative expression of the respective genes in each sample. CT-fish fed the control diet; HC-fish fed the high cholesterol diet (5.1% inclusion); HCA1-fish fed microbial oil (3.1% inclusion); HCA2-fish fed microbial oil (6.6% inclusion). **p < 0.01 and *p < 0.05. Each treatment group consisted of six biological replicates.

Acknowledgments
This image is the copyrighted work of the attributed author or publisher, and ZFIN has permission only to display this image to its users. Additional permissions should be obtained from the applicable author or publisher of the image. Full text @ Front Nutr